

1. The imperative to improve the status quo, why do you need to build better GTM data foundations? And why now?
Over the last year, we've had the privilege of chatting across hundreds of orgs that sell to local businesses. The consensus? It feels like everything has just gotten harder.
Inbound is tapering off. Growth targets in an AI-driven era are higher than ever. Everyone is trying to make outbound work. And every initiative seems to take way longer than it needs to because of broken data.
And all of those things are breaking at a time when the growth targets have never been more ambitious as we enter an 'AI-Native' era.
The one thing holding every GTM team back from growing at an AI-Native pace? Their data foundations.
Definitions
Every GTM data foundation is a unified, refreshed, de-duplicated set of data that contains two core components

- TAM: It enables teams to see every account in their market with enough signals that it can allow for segmentation and scoring of accounts.
- Contacts: It has the verified decision maker contact information such as mobile numbers and emails attached to each account
We hear the following problems over and over again when teams talk to us about their data foundations:
They're burning cash on BPO and offshore teams who don't deliver
Many teams start with trying to outsource the data work to an offshore team. Build a team in the Philippines that goes through Google Maps and Google to find every local business and their contact information.
At the extreme, the spend is staggering. One CRO, a decade into building a national restaurant-technology company, told us they had stood up a roughly 1,000-person offshore team and spent $2M to call every restaurant in the US and log what point-of-sale system each one used. His verdict:
A, it was really freaking expensive, and B, six months later, that data is stale.
The problem with BPO spend is that it is a snapshot, which fails in two ways.
It goes stale.
Businesses close, new ones open, owners change, GMs turn over. The picture you paid a fortune for starts decaying the day it is delivered. In local verticals, roughly 25% of businesses close within their first year. This means a one-time list loses at least a quarter of its value annually before you account for everything else that change such as new software, reviews, and ownership.

And it was never fully reliable to begin with. Here is how the "data" actually looks at the desk, from an SDR at a permitting-software company:
One in every three or four mobile numbers is just incorrect, or the number provided is literally a gatekeeper. So I'll do manual research — log into Apollo, check public sites like TruePeopleSearch — and if there's nothing, I'll just go the cold email route.
And you cannot simply buy more data sources to compensate. A RevOps leader at a large construction-software company — one already paying for ZoomInfo, Dun & Bradstreet, and a licensed dataset — still runs a BPO for contacts, and still calls the problem unsolved:
Contacts? It's definitely not solved. It's always a pain point. Account comes in, reps need contacts, we outsource it to some BPO group that does hand-to-hand combat contact research. It's always been a thorn in the operation — they don't like how it works, but we kind of need something, and nobody's wanted to bite the bullet to do something different with it.
BPO taxes the entire go-to-market system. It ends up eating all of your team's time spotchecking spreadsheets and managing your offshore team for quality.
Every hour spent stitching lists together by hand and quality checking the work of offshore teams is an hour not spent on the systems that would make the next campaign better.
They're struggling with assignment and territory issues
We have heard multiple orgs share stories of reps running into issues with duplicates being assigned to multiple reps.
When this happens, reps may win a deal or lead, but it doesn’t count towards their quota.
This harms morale, creates a distraction for RevOps, and incentivizes reps to be inefficient.
In several cases, we have observed reps spending 5-10 minutes checking whether their account is a duplicate in the CRM manually instead of just focusing on selling.
They're struggling to implement ABM and multi-channel campaigns
In a crowded environment, multi-channel campaigns are becoming table stakes to break through the noise.
For local SMBs, where accounts may be harder to reach on digital channels, this often means using direct mail, where we hear it can drive anywhere from 10-30% of revenue for certain orgs selling to local businesses. One vertical SaaS company shared that they received a 8x lift in outbound conversion rates when sending
Executing direct mail requires great data on which accounts to prioritize, then tying those accounts to a clear delivery address. Ideally the direct mailing address of the owner.
There is an underlying economics question. If you can guarantee delivery to the right people, you would invest more into better, tailored gifts that drive conversion. Creating that capability starts with great data foundations that have all this information available.
You have a rep efficiency problem where they're not calling enough accounts
Almost every org that we’ve had a conversation with struggles with improving the efficiency of their SDRs and AEs.
The problem is complex, but one of the most important variables that can be controlled by orgs is reducing the time that sellers spend on non-selling work, which creates a hard ceiling on the volume of accounts a rep can work each day.

And we find that for orgs that are selling to local, a significant portion of non-selling time is being spent on manual research for decision maker names, phone numbers, and “self-prospecting” their own accounts.
RevOps teams are spending more time on operationalizing CSVs than strategic work
RevOps is a high leverage strategic hire.
Yet we typically hear from RevOps professionals that they are spending the vast majority of their days wrangling CSVs and shifting mountains of data from one source to another. Answering supposedly simple questions (“How many accounts are in this vertical?”) takes weeks of data wrangling to get a coherent answer.
Answering the question is strategic work. The ops should be automated and streamlined. An effective buildout of data foundations will take this work off RevOps plate, allowing them to focus on supporting leadership with decision making and identifying new ways to better support reps.
We hear this most plainly from the people stuck doing the work by hand. A RevOps analyst at a software company selling into franchise and multi-location brands, mid-migration between HubSpot and Salesforce, put it bluntly:
I've been struggling trying to manually import, and it's killing me.
It's not just the import that causes problems, it is also reconciliation: matching records and mapping fields one at a time across two systems that don't agree.
I made the net-new contacts, which took forever — having to go in and find which ones were existing versus which weren't was tricky, just because we have both Salesforce and HubSpot now.
That is a strategic hire spending the day doing by hand what a pipeline should do once.
You're seeing everyone implement AI, but you have no idea where to start
AI agents offer the tantalizing opportunity to reduce automate and streamline the busy work
This is no longer in dispute. We have seen the ability for AI to streamline account research, automate followups, and reliably systemize multi-step plays that used to break due to the reliance of plays on rep discipline.
AI agents are only as effective as the data that they are fed. There’s no magic. If your reps cannot find contact info, run into problems with duplicates, or struggle to personalize on missing signals, AI agents will run into those same problems. Preventing these problems starts with effective data foundations.

Solving the problem requires clean data foundations
When you have clean TAM and Contacts, you can enable the following competencies:
- Sizing every account. Resolve each business to its true buying entity — locations rolled up to the owner or franchisee — and attach the firmographics that predict deal size: location count, revenue proxies, headcount.
- Predicting fit. Tag each account with the signals that drive expected close rate — vertical and sub-vertical, tech stack, owner profile, and the attributes that make it resemble your best existing customers.
- Routing on attributes. Carry the tags routing actually runs on — owner language, vertical, region, size tier — so the right account lands with the right specialized rep.
- Reaching the right person. Supply a current, valid decision-maker contact, because a perfectly scored account you can’t connect with is worth nothing.
And the data foundations support the capability of doing all of the above continuously: a resolved, enriched map of your market that stays current as businesses open, close, and change hands.
For the first time, we have the tools available to tackle fragmented SMB data
Every problem above is a decade old. But solving it finally became possible. Four shifts converged inside roughly a two-year window that now give teams the ability to consider building GTM foundations that solve the root causes of the problems we identified above.
Shift 1 — AI turned manual research into compute
The core tasks in local data are judgment tasks, not lookups: deciding whether a listing is a real, sellable business, whether two records are the same shop, or who actually owns a franchise. Until recently only humans could do that at scale, which is exactly why the status quo was a BPO. Large language models changed that.
They can read a website, classify a listing, extract ownership from an FDD, reconcile conflicting sources, and attach a confidence score — at or above the accuracy of a manual offshore team.
For the first time, walled-garden and unstructured sources like reviews, social profiles, and government records became machine-readable. That capability reaches every stage of the pipeline: sourcing, extraction, matching, verification, and refresh.
Shift 2 — the price of intelligence collapsed
Capability alone isn't enough; it has to be affordable. The cost per token has fallen by orders of magnitude in three years and keeps falling — "the next mini model, at 10x cheaper, gets within 0.1%" (Calum, Moving Frontier). That lets a team convert unreliable BPO spend into repeatable AI spend: the same outcomes are accomplished at a lower unit cost, with higher reliability, no turnover, and continuous operation.
Refresh economics flip too. Refresh frequency is really set by cost-per-check — is verifying a business a curl request, a headless-browser session, an API hit, or a phone call (Fiserv, Grain d03774bb)? AI collapses the cost of checks that would have been previously prohibitive in a BPO model, which makes continuous freshness affordable and kills the one-time list build as a category.
One caveat: These economics work at amortized scale, not per company. Running pipelines across the full universe costs six figures per signal (Aradhya, Research Agents post 6ffc6bde) — "even if the AI web-search hammer alone works, the economics are hard to make work for any individual business" (Calum, Fake Dental Clinics).
Shift 3 — Data infrastructure matured
What used to take a platform team years to assemble is now off-the-shelf: elastic cloud warehouses with cross-org data sharing (Snowflake, Databricks), production workflow orchestration (Temporal), managed scraping and browser infrastructure, and embeddings with vector search.
Shift 4 — the sources themselves opened up
The raw material got more accessible. State licensing boards and government registries increasingly expose APIs, FDDs can be found in public databases, and most business list in public databases. Meanwhile, agent-based collection now reaches the long tail that used to break conventional scrapers never could.
Test your team's understanding before you commit to building
GTM data foundations are not a simple problem, and we realized that many teams believe that the problem is just about finding new data sources and building a scraper.
That's only the first step of the problem you need to solve when it comes to data foundations for local SMBs. So we wrote this guide to give teams the full scope so they understand the size and depth of the problems they will need to solve.
2. Should you build yourself?
Building has never been easier. But it still takes time, focus, resources, and endurance.
So how do you decide what to build? Every team has a circle of competence. These are the capabilities where there is real differentiation where building isn't just defensible but necessary because no vendor can do it for them.
Our belief is that you should be pouring your engineering and RevOps resources into that set. Everything else you buy, so you have the focus and budget for the part that actually sets you apart.
This section explores how to decide what to build, and the decision-making frameworks that you need to support that decision.
A lot of our thinking here is inspired by Kyle Norton (CRO @ Owner), and his talk here:
Are you uniquely better than off-the-shelf providers? What is the opportunity cost?
- Proprietary signal. Does it run on data only you have — your usage, transactions, product telemetry — that no vendor could collect at any price? Then only you can build it.
- Structural edge. Not "could we build it" (everyone can build most things now) but "would ours be genuinely better?" Do you have a durable cost or quality advantage in this specific thing?
- Source of differentiation. Is this where your go-to-market actually wins? Kyle Norton, CRO of Owner.com (a fast-growing restaurant-software company), makes it a challenge: "does it give you a real competitive advantage? If it doesn't, why are we spending our calories there when there are so many interesting things to go build?"
At this altitude, the cost of a build is close to a constant: a couple of expensive engineers for a few weeks, roughly the same whatever you point them at, combined with infrastructure spend.
So what we're focused on is the upside. The deciding question isn't "can we afford to build this?". Most companies can. Instead we're asking: "is the incremental return big enough to justify aiming your scarcest resource here instead of somewhere it would earn more?"
It's easy to get excited about something, build it, and then the gain is incremental — and you just spent two super-expensive engineers working on it for a matter of weeks.
Kyle Norton
The real concern here when choosing what to build is opportunity cost.
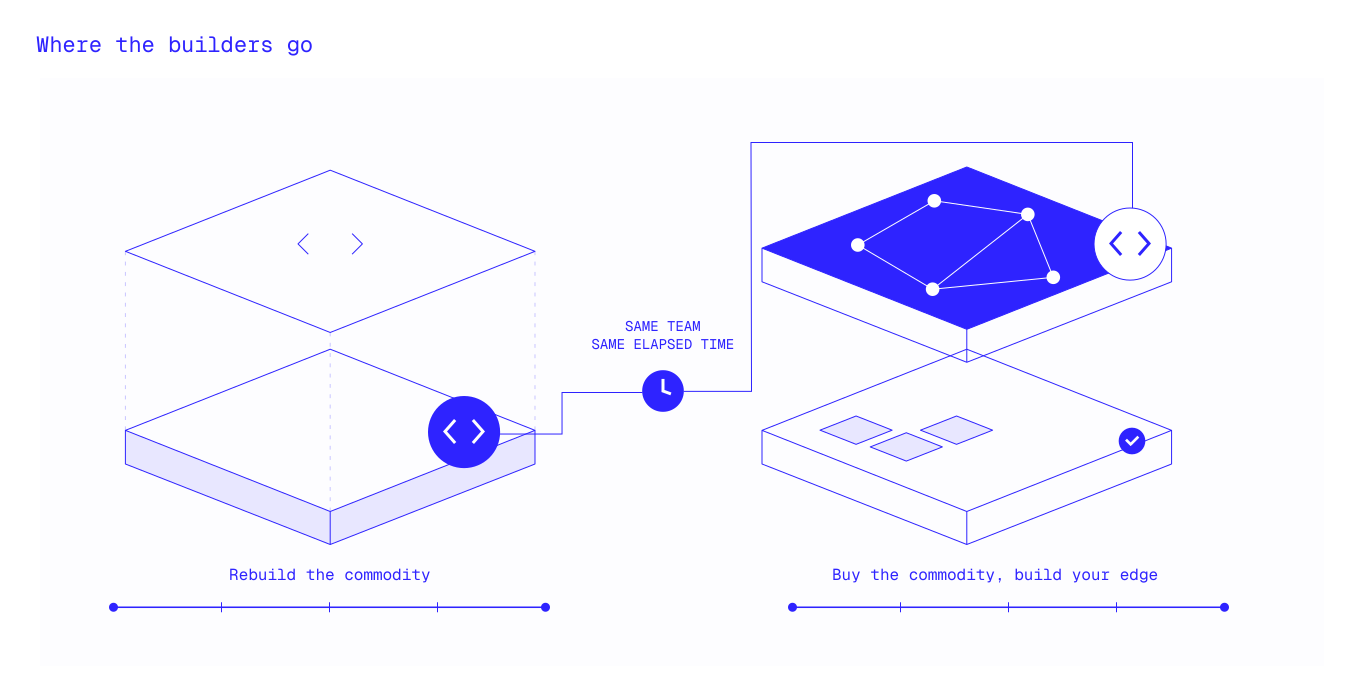
Norton's team runs the same test on real decisions, and he shares an example that shows his decision-making, where he decided to purchase a dialer and build their AI pre-call research process.
Is what you're about to build a commodity, operating logic, or intelligence?
Kyle's test works capability by capability. A second lens that we've heard from Olga Traskoka, VP RevOps @ Birdeye in a public talk focused on a simple categorization framework for initiatives.
This highlights that for teams thinking about building their GTM data foundations, the decision is extremely nuanced. Orgs need to break up their project into separate, independent components to determine which parts of their foundations they should be building themselves.
"Buy infrastructure, build your intelligence" what other teams have built
- Account scoring on your own win/loss history. The highest-leverage build for most teams: a model that ranks accounts by your expected value, trained on your closed-won and churned deals. No vendor has that history, it's based on your proprietary data.
- The business-context model. What "a good account" means, with your rules, plays, and tribal knowledge captured so agents and reps run on it.
- Pre-call research tailored to your buyer.

You don't always have to build alone
Every serious AI vendor is now standing up forward-deployed teams. This presents a new resource for the RevOps team, where they can pair an external partner's domain expertise (sourcing, scoring methods, data manipulation) with your company expertise (where you win, who converted and churned).
As our co-founder describes the choice a customer faces:
There are two different versions of this. Either you have strong hypotheses and we're just providing the signals at the highest precision and recall possible — or it's the real co-build: partner with the team, forward-deploy with you, set up the analytics infrastructure, connect all the first-party and third-party data, and then run the experiments with your data team. Sometimes you get pushback — 'I'll just build internally.' The internal builds fail a massive percentage of the time. This is the hardest thing to get right — it's hard for us to get right.
David Patterson-Cole, co-founder & CEO, DataLane
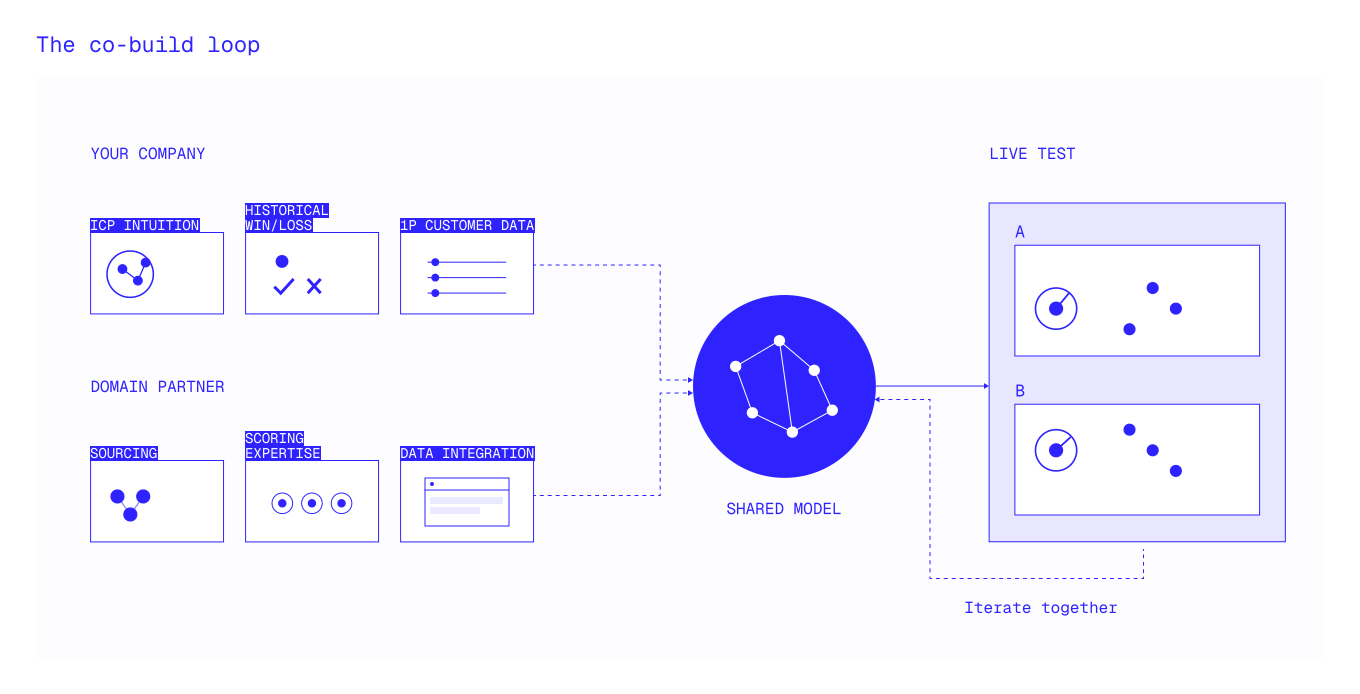
What the co-build looks like for an account-scoring model:
- Customer: sales and product generate hypotheses on where they win.
- Domain partner: source the custom third-party attributes those call for.
- Customer: add the missing first-party data to the warehouse.
- Domain partner: backtest each feature against historical outcomes — were the hypotheses right?
- Domain partner: build the v1 scoring model.
- Customer: stand up the operating process for a live A/B test.
- Together: weekly iteration as results come in.
Building in the AI era - who should be building?
Account executives, sales leaders, and SDRs are not builders. They can help with prototyping and exploration, but a dedicated Applied AI or data engineer will be able to more effectively build a system that can be scaled across a team and improve over time. It’s best to centralize functions like account research, scoring, assignment, and any AI agent builds.
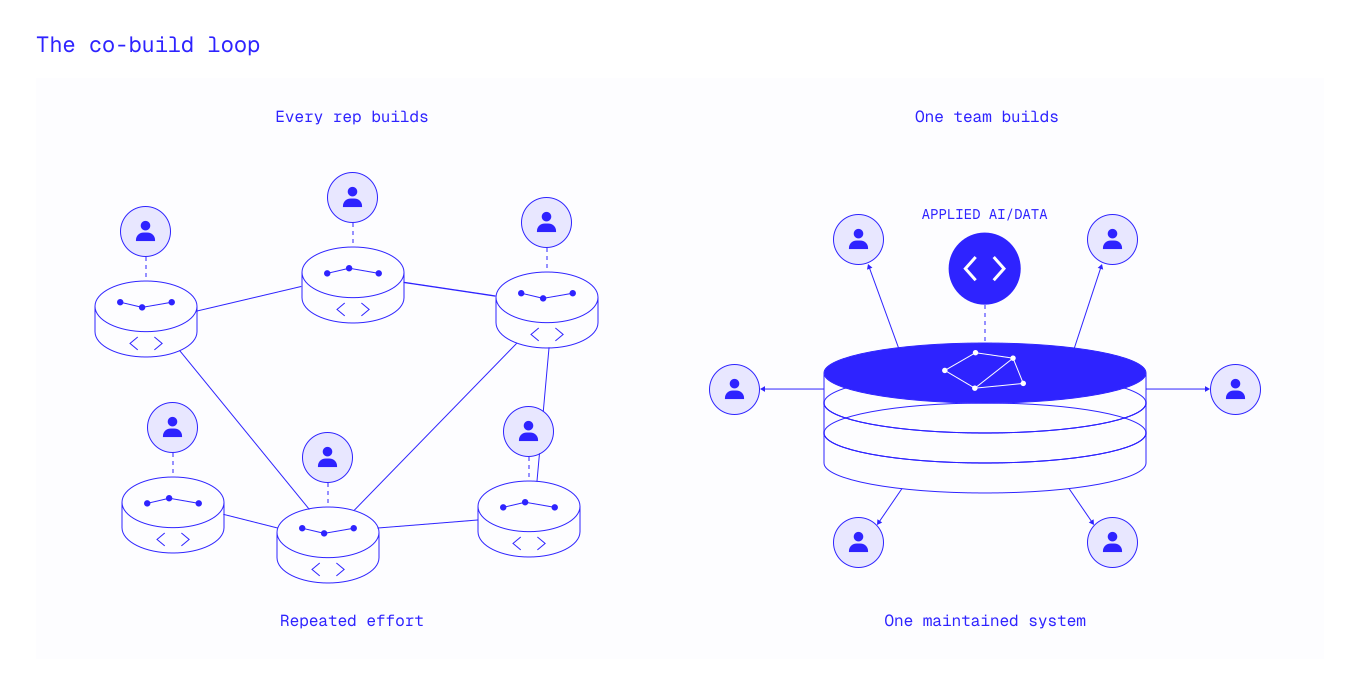
BDRs and AEs are not data scientists or developers.
Kyle Norton argues:
What the applied-AI team builds isn't just 20, 40, 50% better than what a rep might build — it's 5, 10x better … why have 20 people build something to a mediocre level of proficiency when you could centralize those ideas and build something way better?
[Source: David Patterson-Cole co-creation framing — "Bi-weekly Sales and Marketing Connect," 2026-05-22 (Grain 3cb0b360); buyer self-split — "DataLane <> Topline Pro," 2026-04-21 (Grain 76af9d7e). Verbatim in research/david-build-vs-buy-quotes-extracted.md.]
Sources for this section:
- Kyle Norton (CRO, Owner.com), public talk "How Owner.com's CRO Closes $2M+ ARR Per Rep With AI," 2026 — buy-infrastructure/build-intelligence thesis, the five-question test, dialer/PCR examples, centralization. Raw + quotes: research/owner-cro-ai-sales-talk-2026-transcript.txt, research/owner-cro-quotes-extracted.md.
- David Patterson-Cole co-creation framing — "Bi-weekly Sales and Marketing Connect," 2026-05-22 (Grain 3cb0b360); research/david-build-vs-buy-quotes-extracted.md.
- Buyer self-splitting — "DataLane <> Topline Pro," 2026-04-21 (Grain 76af9d7e).
- Amortization thesis (Ramp) — sales-enablement/stories/build-vs-buy-amortization.md (Grain 8fb873dc).
- Owner.com stack slide — images/build-vs-buy-stack.png; source talk https://www.youtube.com/watch?v=BzA8bTjFIgk&t=1239s; David's public post https://www.linkedin.com/posts/davidpattersoncole_build-vs-buy-is-the-wrong-question-for-activity-7422327513562988545-4OIT
3. What data sources can you pull from to build the TAM and Contacts portions of your data foundations?
What does your GTM team need?
What does the end state of your GTM data foundations look like? Ideally this is a project that can support every GTM team (sales, marketing, and CS) to become more efficient.
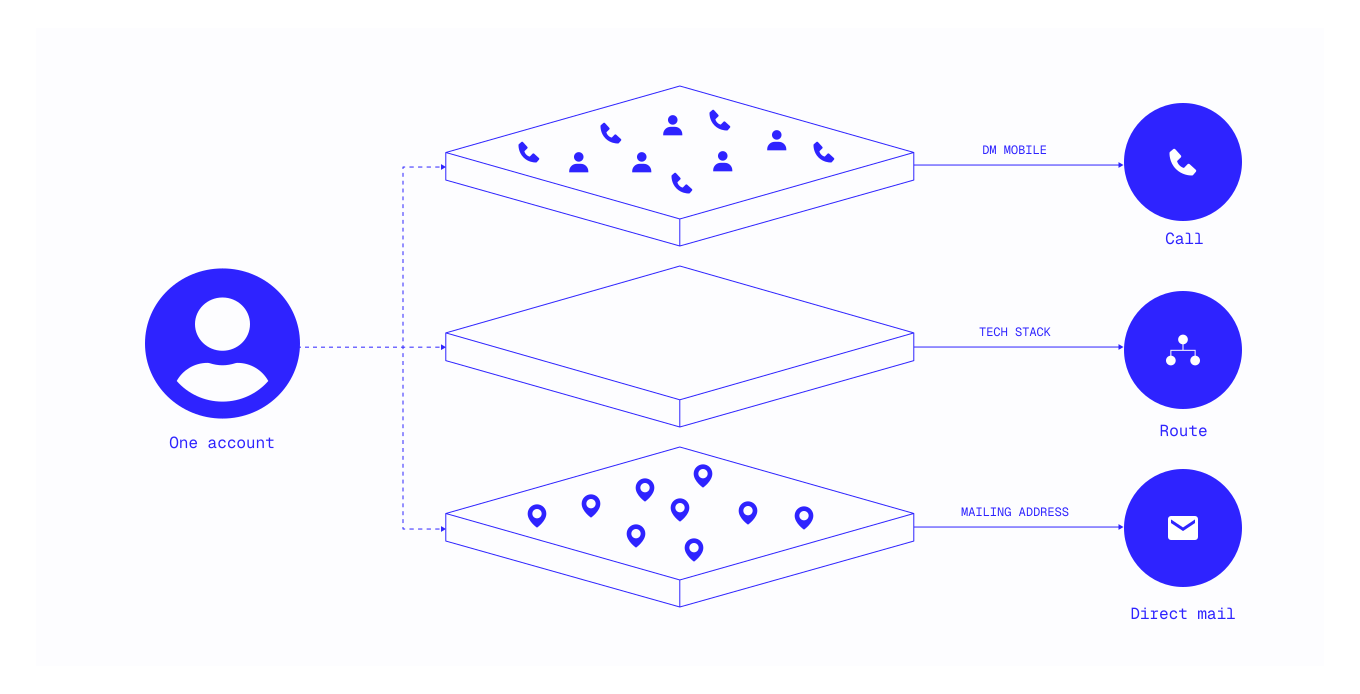
Across the data foundation implementations that we've seen, the most important core columns are universal:
- Decision maker mobile numbers: Allows reps to cold call and reach decision makers directly
- Technological signals: POS, booking software, FSM. High coverage and accuracy on these signals are critical for scoring, routing, and specialized campaigns
- Location phone numbers: Where DM mobile numbers are not present, these allow reps to contact locations and push for a decision maker contact
- Review count: Strong signal for disqualifying poor fit accounts
- Website: Allows for deeper research from agents and reps
- Mailing address: Supports direct mail and field sales motions
- First name: Conversion rate booster for reps cold calling and direct mail
- Decision maker Title
- Location count: How many locations does an account have
- Decision maker email: less effective for cold outreach, but helps with a new touchpoint
- Social media accounts: Useful for deeper research, scoring
Pulling from one single source is never enough.
The shape of local data means no single source or scraper will be able to source all the data you need across Accounts, Locations, and Contacts.
For example, Google will give you most of the account map, but not the contacts, ownership, or firmographics, and it will still miss many businesses that may not be on Google. It will also struggle to separate individual locations vs accounts.
Each source is a partial, overlapping circle; the full, resolved TAM only appears when you combine them, and then resolve the duplicates that combining creates.
In this section, we'll talk briefly about the sources you can work with and in TK SECTION we'll talk more about what it takes to join these sources together.
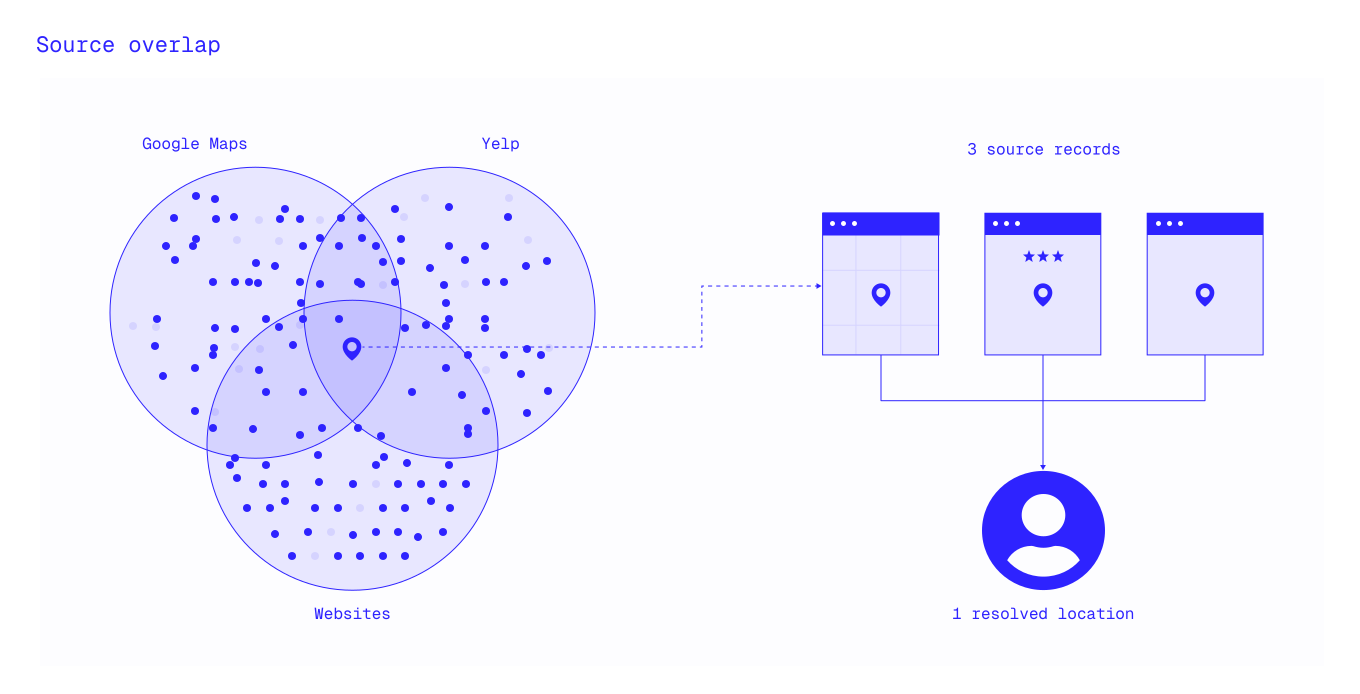
The source landscape and their tradeoffs
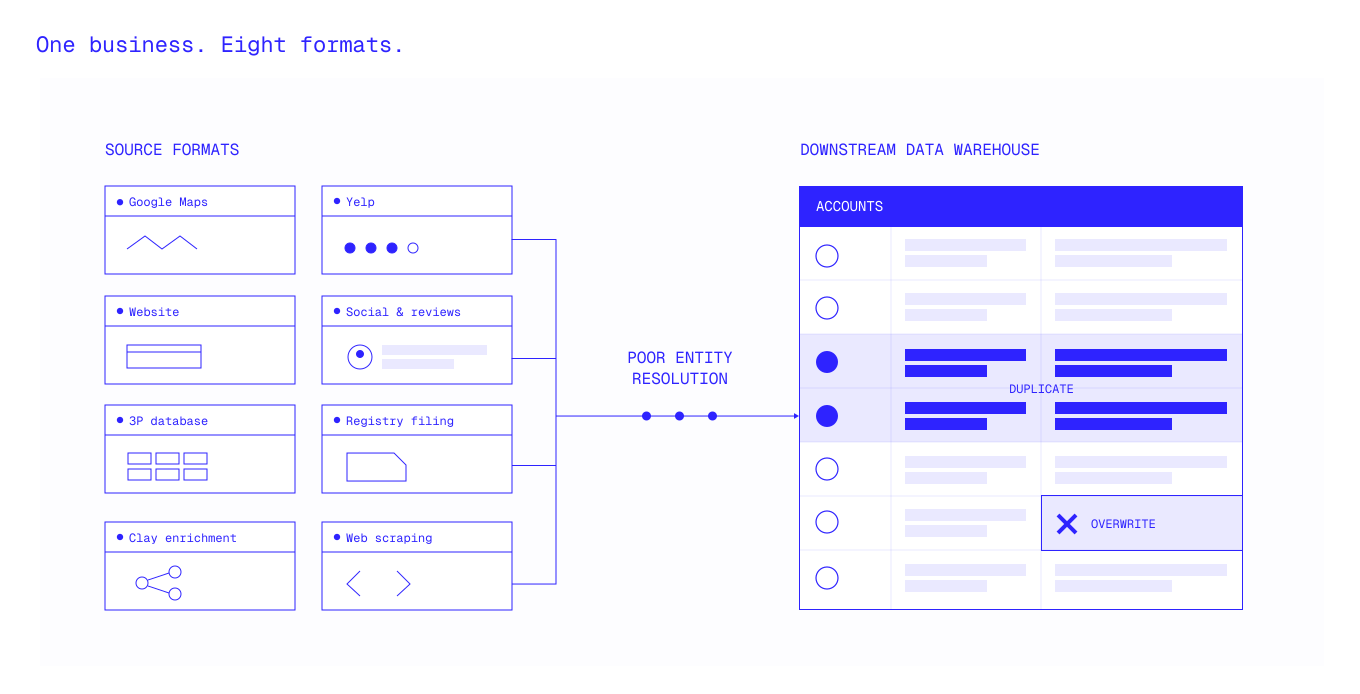
The marginal-lift trap
Every team's instinct is always "just add another source." But each new source multiplies the entity resolution and dedupe work. We've found that teams don't actually see any lifts in coverage until they improve the underlying entity resolution.
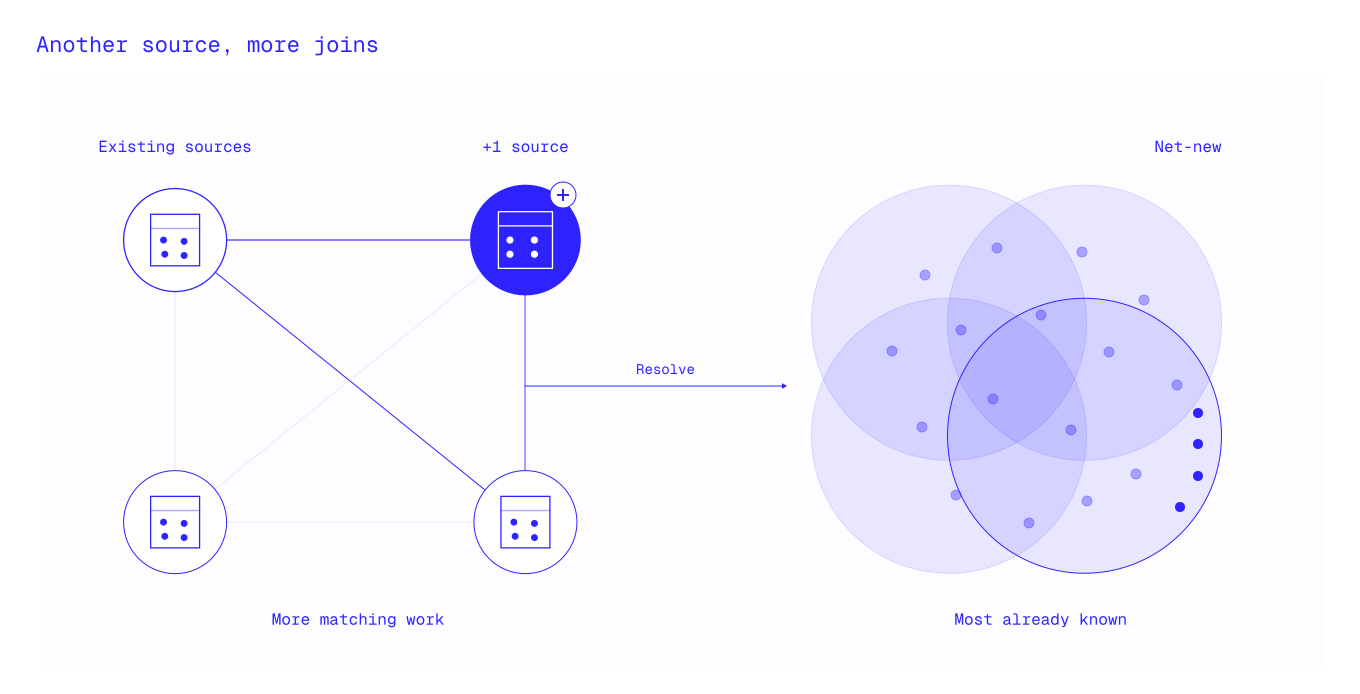
The lift is also wildly vertical-dependent: a new source can be worth ~30% in one vertical and low single digits in another. Adding Yelp on top of Google gave only ~3–4% lift for a heavy matching and dedupe cost in one restaurant pilot.
(§6 covers evaluating the whole foundation you build or buy — bake-offs, held-out validation, production monitoring. This is the narrower question of whether one new source earns its place.)
4. Entity resolution & duplicates - matching
Across hundreds of data sources you can scrape and buy, none of them agree on who's who. The hard part is resolving them into a "single pane of glass" for your entire market. That starts with entity resolution and great matching algorithms.
The three levels you need to sort signals into
Teams also have to be careful to gather these signals at the right level, otherwise you risk creating a mess of duplicates that is impossible to unwind.
Our recommended approach for organizing your data foundations:
- Top Level: Accounts. These represent a single corporation or business structure. An account can have multiple locations and contacts. This is also where website, location count, and a unique tying ID should be placed.
- Next level: Locations. These represent the single physical location. Locations will hold much more information than accounts. These include review counts, technological signals, address, social media, location phone number, and more. Locations should always have an ID that ties it back to accounts.
- Next level: Contacts. These represent the individuals that you want to contact. They should always have an ID that ties them back to accounts. This is where DM mobile numbers, contact first name, emails should live.
Entity resolution is a core competency for building your GTM data foundations
Poor entity resolution is the root cause of duplicates. But framing the problem solely as "deduplication" undersells it.
Matching starts at the account level. When you find an inspection document saying "Joe Smith owns Joe's Pizza," you have to figure out which Joe's Pizza account that ties to before you can attach a single attribute to it. Entity resolution is the act of drawing the edges that turn a pile of documents into a graph of real businesses.

That's also why errors here are the most expensive errors you can make. They flow into every attribute, score, and route built on top:
This is the single most important reason to hold entity-level matching to a far higher bar than anything downstream. A wrong match corrupts the integrity of your entire CRM.
Poor entity resolution acts like plaque in your arteries. A bad matching algorithm silently clogs data pipelines, preventing the strongest accounts from moving forward and polluting anything that it touches. It's the reason teams fail to extract their full TAM.
To illustrate: One public company that we talked to purchased five data sources. In aggregate, those five sources covered every single business in their TAM. We still saw that they consistently missed 20–30% of accounts in every market. The root cause of this was multiple errors in how their data pipelines joined these data sources together.
Local SMB data is nothing like enterprise
In enterprise, matching is easy: everyone has a unique domain, so same domain = same company. In local, you're missing a unique domain more than 60% of the time.
The no-cheat-code framing: in enterprise, matching is easy — same domain = match. In local you're missing a unique domain 60%+ of the time. "Is Joe's on 8 Main Street the same as Joe's Bar and Grill on 17 8th Street? Probably — once you realize both addresses are on the same corner of the block." — Calum Bruton, Lead Engineer, DataLane · Matching Algorithms
It gets harder as businesses get smaller. The smallest businesses carry the least structured identity: no domain of their own (they'll list a GlossGenius, Facebook, or Toast page as their "website"), a personal Gmail instead of a company address, and often no online footprint at all.
These cases seem like exceptions, but there are hundreds of exceptions that typically can add up to 30%+ of the overall TAM. Reliably handling those exceptions in entity resolution is the hard problem when building out your GTM data foundations for local SMBs.
How matching actually works: surface, then evaluate
Under the hood, matching is two steps. First you surface candidates — the records that might be the same business. Then you evaluate whether you have enough evidence to draw the edge between them. The second step is a judgment about probability, not a rule you can hardcode.
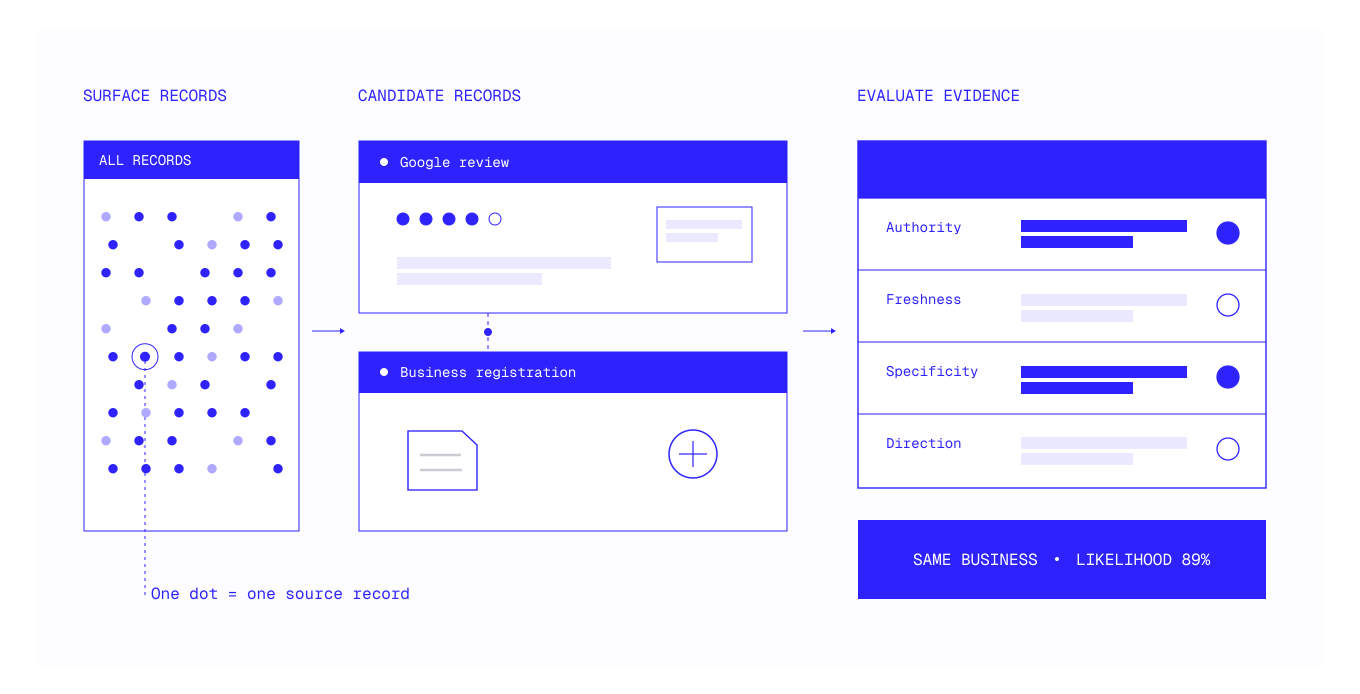
Consider a restaurant called "Cafe China." If there's a Cafe China in the same ZIP code, that tells you almost nothing — the name is common enough that a name-plus-ZIP match is a coin flip.
But if the restaurant is called "Cafe China Extravaganza," the name is so distinctive that the same name-plus-ZIP match is nearly certain. Whether a given signal is enough to draw the edge changes with the information content of the signal itself. That's why naive rules fail: the right decision is different for almost every candidate.
Which is also why you match on a combination of weak signals rather than any single strong one. In local, every individual key is unreliable:
- Domain — 17,000+ Subways share subway.com; social and POS domains (facebook.com, toasttab.com, doordash.com) are shared by millions. You cannot naively match on a website, and shared or managed domains have to be discarded as identity signals entirely.
- Phone — the number you can find is the business line, not the decision-maker; the person you actually want to reach has a separate mobile that's rarely linked to the business anywhere public. So the same business shows up under different numbers across sources (a listed main line here, an owner's cell there), and phone fails to reliably tie a record to either the business or the person.
- Address — dense metros pack many tenants into one building, and the unit or suite ("34B") is usually missing; transaction data often carries a parent or registration address, not the storefront.
- Name — there are 18 Joe's Pizzas; three are related, fifteen just happen to share the name.
- ZIP / geo — one NYC ZIP holds thousands of businesses, so ZIP-plus-industry manufactures false joins.
How do you reconcile signals that disagree?
The difficult cases aren't the ones with no evidence. They're the ones where credible evidence points in different directions.
Suppose two records share a phone number and domain, which argues for a match. But they have different addresses, slightly different names, and different business categories, which argues against one. You cannot settle that by counting three signals on one side and two on the other. The phone might be a shared call center. The domain might be a corporate site used by every location. The different address might mean the business moved—or it might prove that these are two distinct storefronts belonging to the same owner.
Reconciling that conflict requires reasoning about the evidence, not merely accumulating it:
- Authority: Which source is credible for the fact in question? An ownership filing may be decisive about the legal entity but less useful for whether a storefront is currently operating.
- Freshness: Which observation is most recent? A current location page should usually outweigh an old directory record, but only if the page actually refers to this location.
- Specificity: Does the evidence identify this exact storefront, or only the brand, parent company, building, or person associated with it?
- Direction: Does the signal support "same location," "different locations under one owner," or merely "some relationship exists"? Those are three different conclusions.
This last distinction matters. Conflicting signals often do not resolve to a binary match or non-match.
Two records can describe different physical locations that should remain separate while still rolling up to the same account. Forcing that case into a single yes-or-no matching decision is how teams either erase real locations or inflate one owner into a dozen accounts.
A production system therefore needs more than a match score. It needs an evidence trail and at least four possible outcomes: same entity, different entities, related entities, or unresolved. High-confidence cases can flow through automatically. Ambiguous cases should trigger another source, a more expensive verification method, or human review. When the evidence remains weak, refusing to merge is a valid answer; a false merge contaminates everything attached to both records.
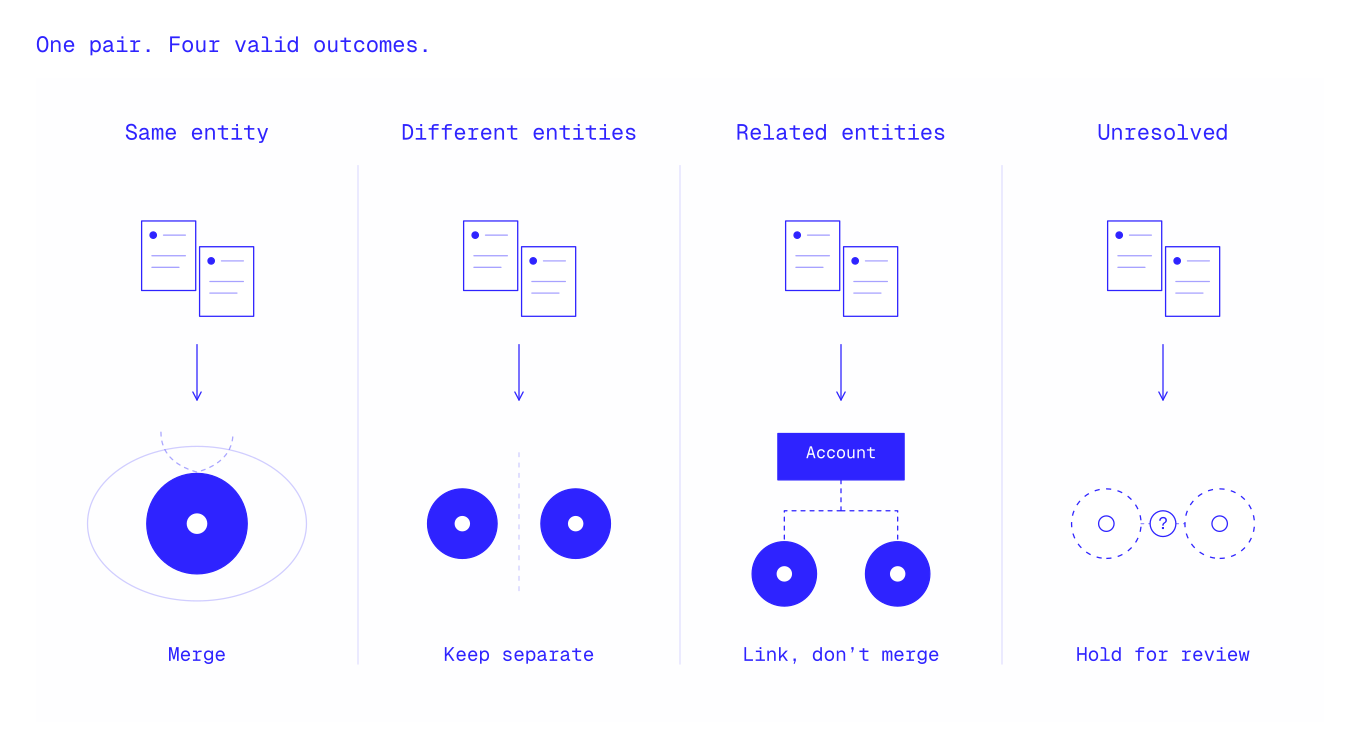
This is the reconciliation problem one of our engineers describes in a public walkthrough.
Match at the location level, then roll up
The practical architecture that falls out of all this: match at the location level, then attach locations to accounts. You resolve each physical storefront first, then tie the storefronts that belong together up into a single account and, above that, an ownership group.
You match the ground truth you can actually observe (a location) rather than the abstraction you often can't (a holding company nobody has listed anywhere). One account can carry many location IDs; a location never carries two account IDs.
Franchise Matching challenges you'll run into
Franchises. The hard part isn't finding the data — it's knowing when two records are the same owner and when they only look alike. Our lead engineer, Calum Bruton, laid out the canonical example publicly — we're embedding it in full because it's the clearest picture of why naive matching breaks:
Calum Bruton — Lead Engineer, DataLane · "The Smith Problem" (LinkedIn, June 2026)
The "Smith Problem" is one of the many edge cases that break reliable franchise hierarchies in local GTM data. If you're trying to build your own data foundations for franchises, you need to solve this.
This is a well-known problem at DataLane, and another small example of the challenges we face daily in building and maintaining our data foundations.
Franchise data starts with a Franchise Disclosure Document (FDD). They are legally mandated document provided by franchisors to prospective franchisees. It contains 23 specific items detailing the franchise's background, franchisee information, legal obligations, and financial performance.
When you look at a Franchise Disclosure Document, you get location-to-ownership attribution. Sometimes the owner is listed as a person. Other times, it is an LLC. And depending on how the operator structures the business, every location can technically be under a different LLC or a different individual name.
For example, husband-and-wife operators may put half their locations under one name and half under another. Our job is to accurately identify those relationships so you get the correct view of a franchise system's accounts, owners, and true decision makers.
But every brand has its own unique problems. In Subway's case, one of those problems is the prevalence of the last name Smith.
There are hundreds of Subway accounts with a contact whose last name is Smith, representing over 10% of the account universe. There are also more than five completely unrelated accounts for each of the names Joe Smith, William Smith, and David Smith.
That makes ownership structures extremely confusing.
A naive matching algorithm can go wrong in both directions. It can under-roll, leaving your sales team working five times more accounts than actually exist because the same owner is split across too many records.
Or it can over-roll, incorrectly merging unrelated owners and cutting your TAM by multiples.
And this does not only happen with Smith. It happens with other common last names, similar LLC names, shared addresses, family operators, multi-entity ownership structures, and brand-specific quirks.
Determining when to draw an edge in this graph takes serious work: engineering, data exploration, additional sources, QA systems, and countless examples across brands.
That is the hard part: not just finding the data, but knowing when two records are actually connected and when they only look like they are.
The "Smith Problem" is just one of hundreds of edge cases that we solve for in local gtm data, and we discover more every week.
When you resolve a franchise brand properly, a sales team's list of "accounts" routinely collapses to a much smaller set of real ownership groups.
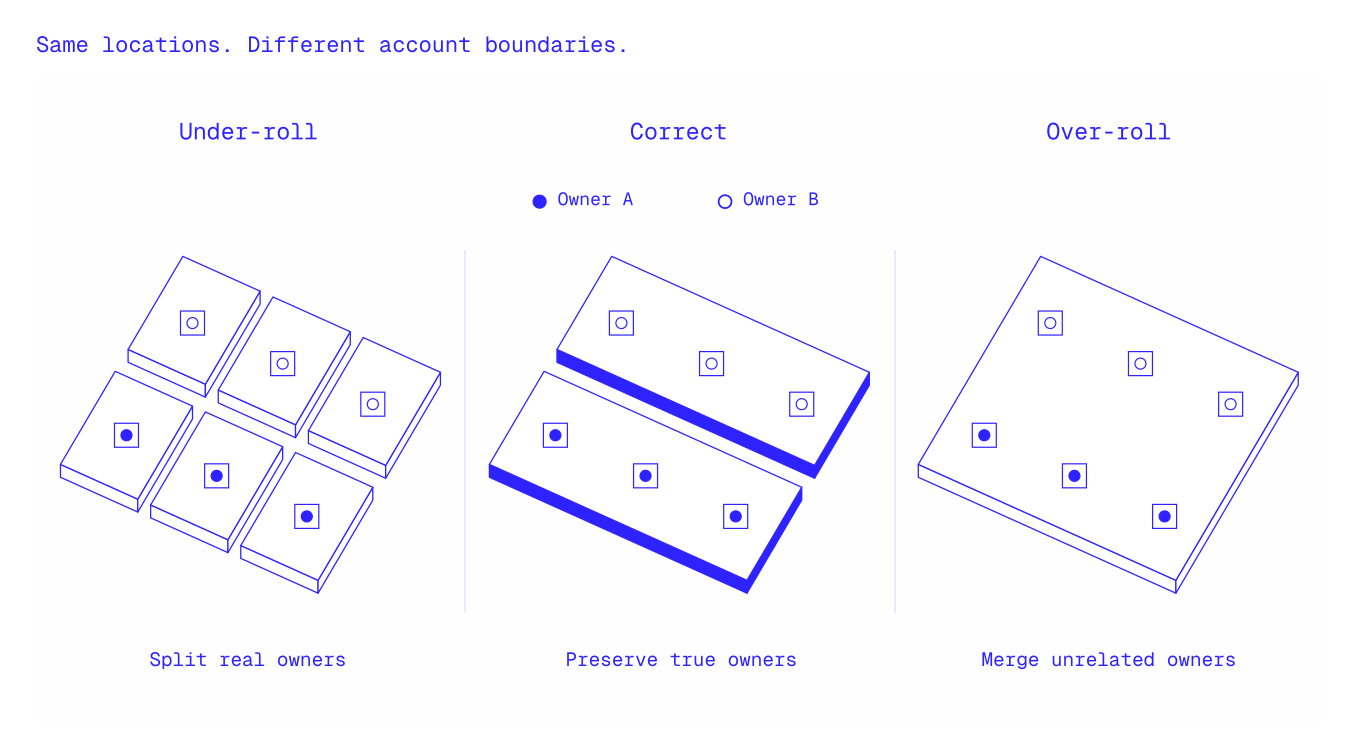
In two brands we resolved for one customer, a provided list of 2,168 accounts for one national franchise came out to 614 real holding groups, and 842 accounts for another came out to 248 — after flagging the not-yet-opened, non-US, duplicate, closed, and junk records along the way.
A few of the exceptions that you'll have to watch out for in matching:
Beyond the three categories, a long tail of traps corrupts a slice of the data every time one goes unhandled. A representative few:
- Legal name ≠ trade name ≠ DBA. Transactions and registrations post under a holding-corp or legal name that won't join to the storefront by name. As one home-services data expert put it: "you have to map LLCs to DBAs — that's the hard part." A record can look like it has no data at all simply because it's filed under a name you didn't connect.
- One building, many businesses. In dense metros several tenants share one street address and the suite is missing, so address matching collapses distinct businesses into one.
- Same phone + same address + two different names. Two providers in one practice? A shared receptionist? A business that changed hands? This is our canonical dedup probe — guess wrong and you either merge two real businesses or split one in half.
- Corporate-vs-franchise-owned and brand-in-brand contamination — for example a fast-food record contaminated by the gas station it operates inside. Entity resolution is a constant process that is part of your data pipelines. When you
5. Maintaining data pipelines: the dataset is a living system
We refresh data across roughly 15 million businesses. Every listing gets re-checked at least once every 30 days; in the largest metros, including New York, Miami, and Houston, it is every 14.
That cadence handles one part of the maintenance problem: the businesses themselves keep changing. They close, move, rebrand, change hands, add products, and switch vendors.
But a core dataset can become wrong even when the underlying business has not changed. The sources can change too.
Websites get redesigned. APIs rename fields. Platforms render the same fact differently. A detection strategy that worked perfectly at launch can keep running without errors while finding less and less of the truth.
Building useful data foundations requires you to periodically update them. It is a living system for observing a market. Maintaining it means keeping both the records and the machinery that produces them aligned with reality.
How often do you need to refresh and maintain your data?
As a benchmark 22% of small businesses close within their first year. This is the baseline rate at which your TAM gets outdated on an annual basis.
There is also the inverse, where you want to be able to capture high value accounts like new business openings or pre business openings.
Research from the Economic Innovation Group estimates that 322,000 new physical establishments opened per quarter.
On contacts, mobile numbers increasingly change hands quite frequently (at least 5% per year), so numbers and the validation checks they went through get stale.
This means constant refresh is required to keep your TAM and Contacts datasets up to date.
The decision on your org’s refresh cadence is a question of where you want to distribute costs: upstream or downstream.
Keeping costs upstream
Keeping costs upstream means you would rather spend engineering, revops, and tech spend to catch the issues before they affect the downstream operations of your marketing and sales teams.
In a perfect world, you could only refresh a portion of your TAM, but this is a Catch-22. You don’t have the data to know which accounts are the best ones to be working, until you get all the latest info about them.
You also generally benefit from keeping the entire universe fresh, as it allows you to be thoughtful about selecting the accounts to work and it allows ongoing strategic work that is needed for TAM sizing.
When teams are not refreshing their TAM and Contacts datasets at least monthly, they are accepting the creation of downstream costs in their GTM org.
What happens downstream when you spread out refresh cadences
If you choose to spread out refresh cadences, your costs shift downstream into your GTM org. Here are the most common scenarios that we see:
- Direct mail and physical gifting campaigns are sent to the wrong addresses.
- Reps cannot hit cold call daily targets as they start manually researching accounts, killing rep efficiency and the economics of a BDR motion. Each minute of manual research to accounts adds over an hour of non-selling time for orgs targeting 100 dials a day
- Reps spend dials calling accounts that have no chance of closing
- Territories become inflated and unbalanced as businesses close
- Strategic decision making around new verticals to target and campaigns are built on incorrect assumptions
You have to calculate the value of these “soft” costs to your organization and weigh them against the upstream costs to determine your refresh cadence.

Defining “drift” and all the issues that come with keeping your data fresh
Emile Flavin, who helps build and operate DataLane's core datasets, defines drift this way:
"The analysis you do, which might be 100% correct today, might not be the correct analysis in two months, three months, six months. And because the analysis changes, your data quality is going to degrade over time. It's going to drift from the source of truth."
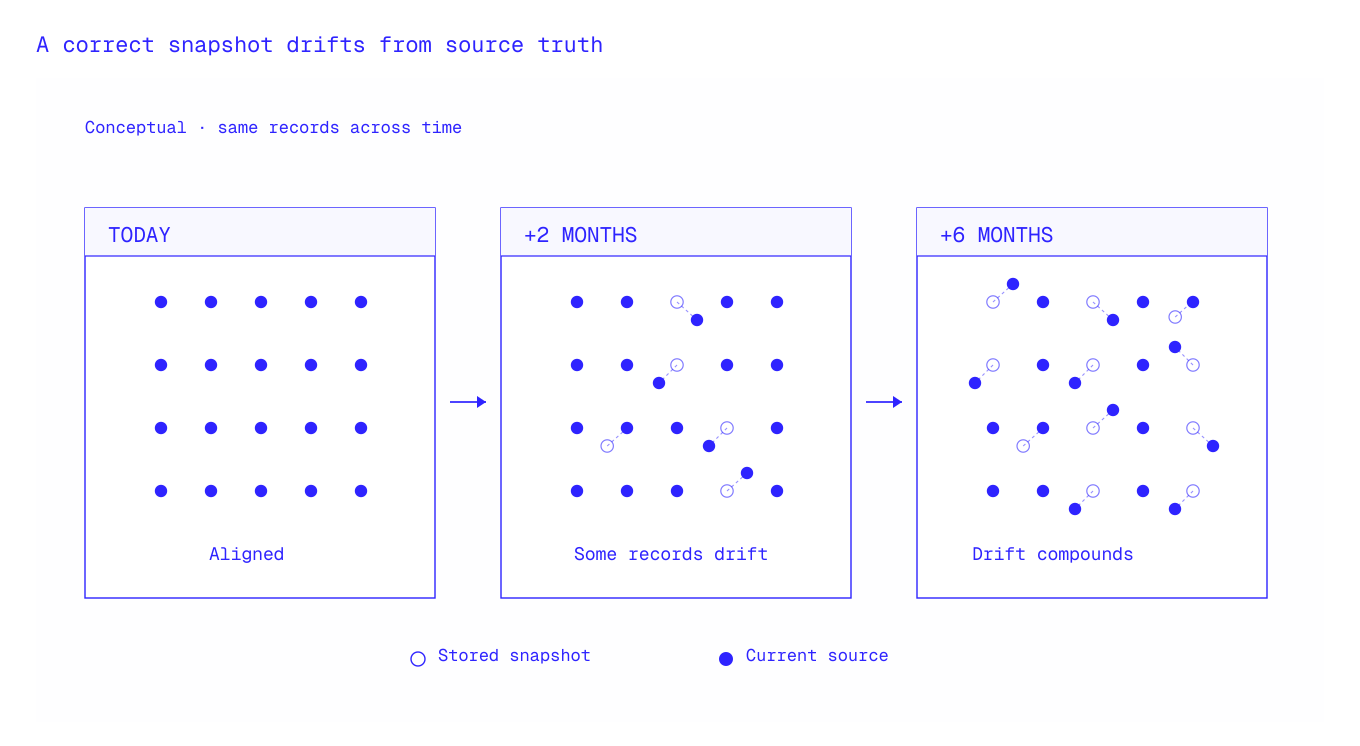
That definition is more useful than dividing drift into a long taxonomy. There is one underlying problem: the output of the system is moving away from what is actually true.
The world changes. A restaurant closes, a salon moves, a franchise changes ownership, or a business stops using a delivery marketplace. The record was correct when you collected it; now it is stale.
Roughly a quarter of the small businesses on some lists can go wrong within a year, with salon and wellness lists running 20–30% dead in twelve months.
Your way of observing the world stops working. Emile's example is a pipeline that detects a leading food delivery marketplace by looking for a particular expression in a website's HTML. The marketplace changes how that information appears, so the search term stops matching. The restaurants have not necessarily changed vendors and the job may still complete successfully. But the pipeline starts missing real instances, so recall falls.
Google Place IDs demonstrate how the two can combine. When a listing moves, closes, or gets merged, its identifier may change. If your internal joins depend on that external ID, the record change becomes a pipeline failure: locations silently detach from the accounts to which they belonged. Our CTO's recommendation is explicit:
Make everything off of the DataLane ID… the Google IDs change. Every month a few percent of them are changing from one place ID to another.
This is what makes drift dangerous. Infrastructure dashboards can stay green while data quality deteriorates. A job completing is not the same as a job continuing to observe reality correctly.
Refreshing the data and maintaining the method are different jobs
Teams often treat maintenance as a scheduled rerun of the original collection process. That only works if the original process is still valid.
These jobs should not share one cadence. You may decide that a particular attribute only warrants a full refresh every six months. But it cannot safely wait six months to learn that the method stopped working in month one.
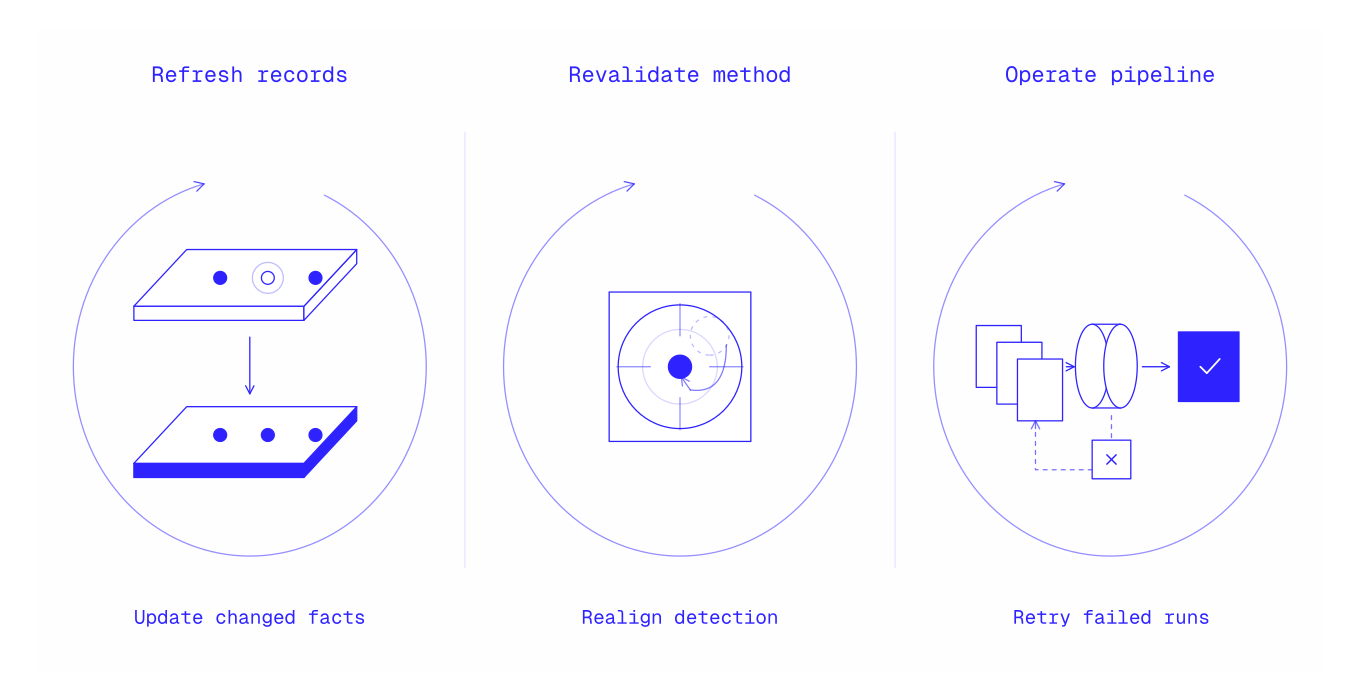
Emile recommends keeping freshness and reliability near the top of someone's priority list after launch. DataLane reports daily on whether systems are live, working, and degrading. Even for a six-month refresh cycle, he recommends putting roughly the same effort into the refresh as the initial build, because the data and the method may have moved substantially in the intervening period.
How you catch divergence before your reps do
Emile describes three layers DataLane uses to keep a production method aligned with the truth.
1. Make operational failures loud. If a scrape fails, it should alert, retry, or stop the affected output from being published. This does not detect every form of drift, but it prevents ordinary engineering failures from masquerading as legitimate empty results.
2. Grade the production method against a stronger reference method. DataLane runs a second search or detection strategy that can be five to ten times more expensive but is designed for much higher recall. The cheaper production strategy is compared with that reference. When the gap widens, the team has evidence that the cost-balanced method is no longer finding enough of the truth.

This is the connection between maintenance and evaluation in §6: the golden set and high-recall reference method are not only launch tests. They are ongoing controls for detecting degradation.
3. Inspect the data manually. Emile manually spot-checks at least one type of attribute every day, rotating what he examines. Automated controls catch anticipated failures. Direct inspection is how the team finds the edge cases it did not know to encode yet.
"You learn so much from just going into the data and exploring what's right, what's wrong. It's never time wasted to do that." — Emile Flavin
The point is not that every build team needs one person reviewing every attribute daily. It is that somebody must remain close enough to the output to notice when the system is becoming confidently wrong. A fully automated pipeline with no human quality loop is not maintenance-free; it is unobserved.
Refresh cadence is an economic decision
A buyer pressure-testing DataLane asked the practical question:
How often is this refreshed? Is it batched or continuous? What actually changes inside a two-week window?
There is no universal correct cadence. It depends on four things:
- Volatility: how quickly the underlying fact changes.
- Cost of error: what a stale or missing value does to the sales motion.
- Cost per check: whether verification requires a simple request, a headless browser, a paid API, an LLM, or a phone call.
- Source stability: how likely the collection method is to stop working between refreshes.
At 15 million locations and hundreds of potential attributes, small per-record costs become an economic ceiling. At DataLane, we can selectively use expensive methods such as cross-source verification, image analysis, or programmatic phone checks. But we cannot apply every method to every location every week.
A restaurant software company's internal LLM pipeline shows what that looks like for a competent build team. It processes 30,000–50,000 restaurants, assembles the result five times per record, and takes at least half a day or overnight for a full regeneration, followed by manual failure triage. The team refreshes it every three months because weekly regeneration is uneconomic.
That is not an engineering failure. It is a rational operating decision. It also means the data is six weeks old on average by design. There are some tradeoffs here. That might be ok if you are doing one time TAM pulls. It creates problems if you do a monthly territory evaluation that needs fresh data.
The recurring cost is easy to underestimate because a refresh sounds cheaper than a build. Usually it means collecting and processing the same population again. Emile's point is that pipeline maintenance, repeated acquisition, continuous testing, expensive benchmark runs, and manual QA require a dedicated resource in perpetuity to maintain. That needs to factor into your total cost of ownership which we talk more about in Section 7.
The machine around the detection logic
The scraper or model is only the visible part of a production system. Around it sit queues, prioritization, retries, state management, rate limiting, failure visibility, and rules that prevent incomplete output from reaching the dataset. Calum Bruton, an engineer who has written publicly about building these systems, puts the trap succinctly:
AI makes the first version easier to build. It does not make the production system easier to operate.
That burden compounds in three ways.
Scale manufactures edge cases. Emile notes that a strategy run across millions of locations reveals failure modes that may never appear in a sample of 1,000, 10,000, or even 50,000. Each discovered exception becomes a decision: update the method, add a test, accept the miss, or pay for a more expensive strategy.
Infrastructure keeps outgrowing itself. Build teams move from laptops running overnight to large VMs, distributed rate limiters, and eventually workflow orchestration. The work never settles into "done" because volume, API limits, source behavior, and throughput keep changing.
The model frontier moves too. New models continually change the available trade-off among accuracy, coverage, latency, and cost. Without a fixed evaluation harness, every upgrade becomes a guess. The new model may be better, or merely more expensive in a way that disappears when the next small model ships.
The result is a system that must be operated, evaluated, and improved at the same time. As Calum puts it:
These systems are usually harder to maintain than build.
Who owns the health of the dataset?
Emile describes shared ownership between engineering and business operations. Engineering owns the resilient, repeatable infrastructure: retries, orchestration, blockers, observability, and scale.
Business operations (RevOps) stays close to customer requirements and the data itself: deciding what truth matters, inspecting output, finding new failure modes, and determining whether a more expensive method creates enough value.
The boundary can blur, but the accountability cannot. Before starting the build, the organization should be able to name:
- Who reads the daily degradation report?
- Who investigates when recall falls but every job succeeded?
- Who re-verifies the reference set as the businesses inside it change?
- Who decides whether to spend more for better coverage?
- Who updates the detection method when a source changes?
The common failure is mundane: the person who built the scraper leaves, nobody inherits the context, and the system keeps running while trust in its output slowly collapses.
I don't want to build scrapers,
one team told us after watching exactly that happen.
The bottom line. The build-versus-buy question is not whether your engineers can produce the first correct TAM. They probably can. It is whether you want to fund the permanent system required to keep its records, detection methods, infrastructure, and evaluation aligned with a market that never stops moving.
6. How do you know if what you built or bought is any good? Evaluation criteria
A dataset nobody trusts is worth nothing, however much it costs to produce
So many downstream operations depend on a precise data foundation. Scoring, marketing campaigns, TAM sizing, and cold outreach all break when they rely on faulty datasets.
So when you scope out budgets and resources for the build of your GTM data foundations, you must factor in the need for constant checks and evals for that dataset, which will then inform the maintaining team on what they need to build.
There are two key types of evaluations that need to occur for your GTM data foundations:
- The point-in-time test. A pilot or bake-off that grades a dataset before you trust it, whether it came from a vendor or from your own first build.
- The continuous test. The automated evaluation that keeps it honest in production, because a dataset that was good at launch decays from day one (see §5).
And we'll document the approaches and fundamental core concepts to both, including some of the most frequent and damaging mistakes that we see during the evaluation process.
Precision and recall: the two core components of "accuracy"
Every data-quality conversation is really a conversation about two numbers. One of our engineers, Emile Flavin, frames them the way we use them internally:
"Precision is trying to not assert something that isn't true — to avoid having false positives. Recall is trying to avoid false negatives, where you're missing some ground truth that exists out there in the world." — Emile Flavin, DataLane
Put formally, with true positives (asserted true, and true), false positives (asserted true, but false), and false negatives (true, but missed):
Precision = TP ÷ (TP + FP). Of everything you asserted, the share that was right.
Recall = TP ÷ (TP + FN). Of everything actually true, the share you caught.
Measure precision and recall separately, and per field. Never blended.
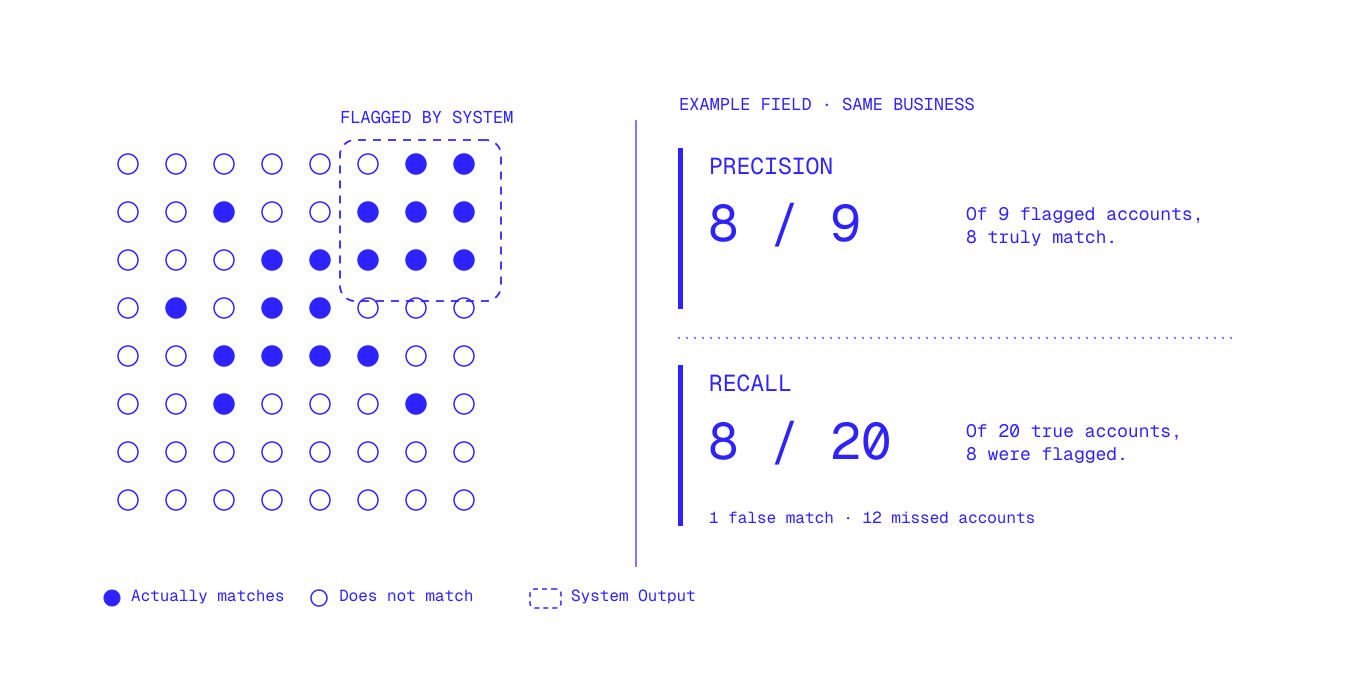
A "90% accurate" dataset is a fiction that averages a source's strengths and weaknesses into a number that describes neither.
The whole point of doing a precision/recall evaluation is determining the next action you need to take to improve the core dataset, and understand the tradeoffs you're accepting in the data.
One source can be excellent on business names and useless on owner mobiles. That's actually fine if all you're trying to do is determine your TAM. It's terrible if you are planning on using that data source to feed your SDRs mobile numbers.
Another source might be best in class at determining POS data, while being completely blind to social media accounts. If social media is an important part of your enrichment workflows (maybe your team finds success with Instagram DMs) then the next action you want to take is improving recall on those accounts.
Do you want more precision or recall? What's a good benchmark?
We find that in the context of a GTM team, precision (avoiding false positives) is much more important.
From an org perspective, low precision erodes trust across the organization. And when trust erodes, there are common symptoms that we see:
RevOps struggles with change management for reps: They push back against any change. When the data is bad, and the person delivering that data is telling them to stop doing manual research, they're not going to listen.
Low precision in the dataset erodes your ability to do any form of coordinated "play" or segmentation. For example, we see direct mail is driving significant conversion rate lifts for our customers. You would rather have high precision (more correct mailing address) vs high recall (more addresses, but a higher % of them are bad). Most teams would rather have confidence that 95% of their direct mail spend will actually be delivered to the right decision maker and address due to the cost of the gift itself.
We would say that when testing precision, the benchmark you want to achieve is 95%, where 95% of the data you find is accurate. Anything lower than that will drastically hurt your GTM team's operations and erode rep trust.
Different signals will have different levels of recall
Benchmarking for recall is much more complex than precision. Any given signal will have its own specific level of detectability.
A signal that has a high level of recall would be booking software for a salon. Booking page links are usually publicly available on a salons website or social media.
Compare that to a signal like POS, which is much harder to detect. POS may not leave any markers of online activity, and may only be detectable when you examine photos or have someone call into the restaurant. You would naturally expect recall to be much lower for this signal.
To determine whether a field is naturally lower recall, just spend 10-20 minutes seeing if you can find the answer yourself. If a smart human is not able to get the answer, your data pipelines will also struggle to fill those out.
What you're trying to avoid above all is upping recall at the sacrifice of precision. You should be comfortable with blank fields, especially for signals that are harder to surface.
You can always spend more to improve recall. You can almost always buy more recall by throwing more compute or more sources at the problem, but the returns collapse fast:
"You could review every webpage that is tangentially related to this business in search of a needle in a haystack, in hopes of boosting recall … but often the returns associated with those really expansive strategies diminish really quickly. So when we're designing attributes, we're looking for that plateau where we are providing the best quality data possible without incurring prohibitive costs, and without introducing … false precision." — Emile Flavin, DataLane
The goal is never a perfect dataset. It's the best operating point before the curve flattens, and where you set that point is a business decision, not a technical one. Ask which errors are expensive for your motion:
- Reps dialing dead businesses is precision-expensive. Every false positive costs an entire call, and compounds by eroding rep trust.
- A TAM that misses real accounts is recall-expensive. Every false negative is revenue you potentially miss and a smaller territory.
Most build teams never make this choice on purpose. They inherit an operating point by accident, whatever their first algorithm happened to produce, and discover months later that it was tuned for the wrong kind of mistake.

Building the golden set: your answer key
You can't measure precision and recall without knowing the right answers.
"Precision and recall are hard to ground-truth. My argument is there's no such thing as ground truth — you just have to build a golden set." — David Patterson-Cole, DataLane
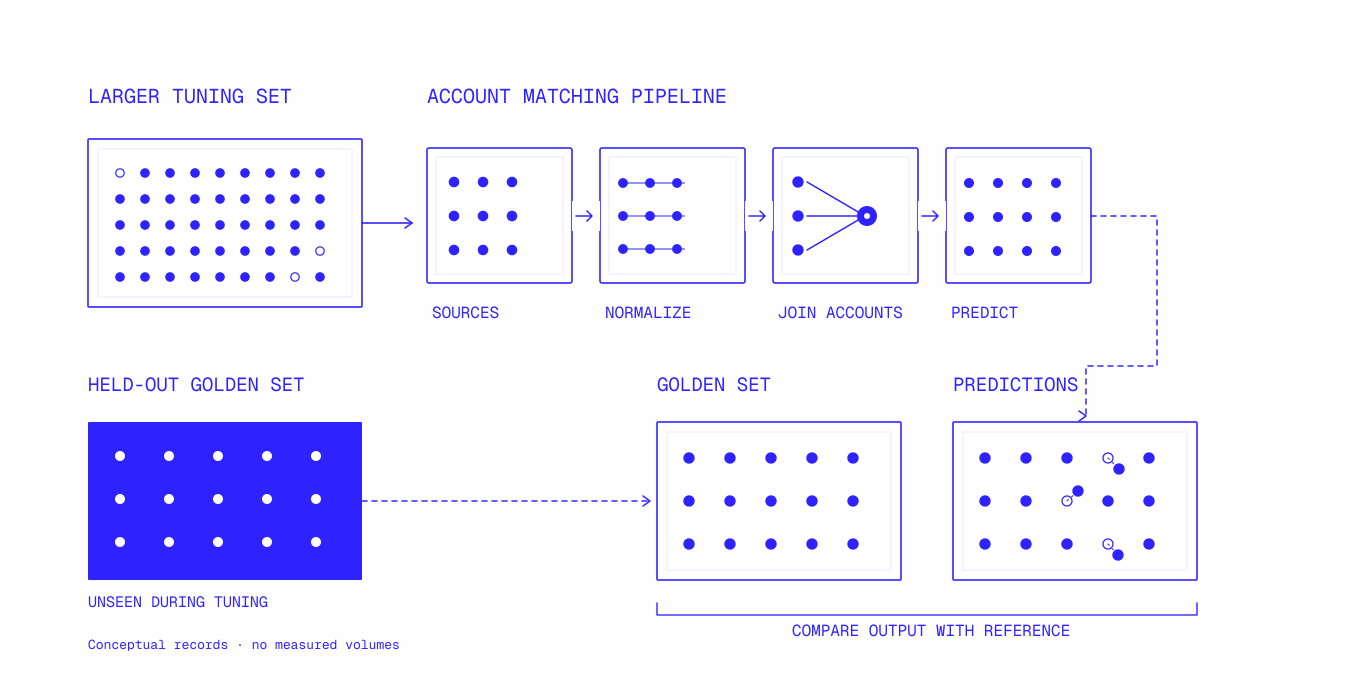
The golden set is your ground truth: a curated, hand-verified set of real records where you know the true answer for every field and every rollup, that you grade every source, and every version of your own pipeline, against. It's the most important thing you build in evaluation, and the most commonly skipped.
How to build the golden dataset
- Sample real cases, not synthetic ones. Pull records from your actual target market. An LLM can help you find outliers and expand diversity around real cases, but it can't invent the truth: "the golden set has to come from the real cases you selected." Sometimes this means going to Google or Instagram to build out a golden data set row by row.
- Make it representative reality, include the "exceptions". Stratify by sub-vertical and segment, and deliberately over-include the messes: no-website SMBs, collision-heavy names, shared addresses, rural zips. A golden set of easy, well-documented businesses certifies nothing, because those aren't the records your pipeline will get wrong.
- Establish truth by hand, one record at a time. A person confirms each answer: call the number, load the site, confirm it's open, verify the rollup by eye, and where you can get them, anchor to authoritative documents (incorporation filings, Franchise Disclosure Documents). Decide what "correct" means per field before labeling, or your labels won't agree with each other.
- Feed failures back in. Every new edge case that breaks when you run an evaluation should be added back in as a permanent test case. Maintaining the golden dataset is a dynamic exercise and "the golden set needs to be updated — you find a new outlier, you put it into the cases." (Emile)
How big? Two sets, two sizes:
- The curated golden set is small and deep: a few hundred hand-verified records, the same order as the 200–300-account pilot below. Keep it that size deliberately, since a human verifies every row and you're buying depth rather than volume. Stratify it so every segment you care about has enough records that one wrong row doesn't swing its score.
- For production rate estimates, layer on larger random out-of-sample audits — on the order of 1,000+ records, grouped by sub-vertical — because rare failure modes only surface at scale: you "probably wouldn't discover [them] with a sample of 1,000 or 10,000 or sometimes even 50,000." The small golden set is your fixed yardstick; the big random audits tell you the rate in the wild.
Two rules that keep it honest
- Hold part of it out. Never let the pipeline, or a vendor, tune against the exact set you grade with; lock a portion nobody building the system ever sees (Trap 3, applied to your own team).
- Refresh it. The golden set decays too, as businesses in it close, move, and get acquired. Re-verify it on a cadence, or you're grading today's data against yesterday's truth, specifically, the hard one since you can't easily count what you missed, use the expensive exhaustive-search reference from the continuous-test section below as your ~100%-recall ceiling.)
The point-in-time test: running a fair pilot (and the traps that void the result)
Whether you're grading a vendor or your own first build, the mechanics are the same, and so are the ways the test gets quietly rigged.
The whole test grades against the golden set from above. That hand-verified answer key is the entire basis of a fair pilot, and there's no shortcut around building it. With it in hand, the job is to run the test without rigging it.
The rules that make it fair:
- Same list, apples to apples. Pick the same geo or franchise brands that you want to evaluate all your vendors or internal builds on.
- The evaluator picks the set, never the seller or builder. The fastest way to inflate a result is to let whoever's being graded choose the sample.
- Pick the hard accounts, not the easy ones. Everything looks great in dense metros where every business is well-documented. Weight the sample toward the zips and messy verticals your team already struggles in. A test that over-indexes on New York and LA will tell you the data is excellent, right up until your reps start calling the rest of the country.
Then avoid the five traps that void the result.
Trap 1 — Grading on downstream metrics you don't control. Meetings booked and win rates depend on scripts, timing, rep skill, and the market, a dozen variables the data can't touch. Judge the data on what the data controls: coverage (recall) and accuracy (precision).
Teams that skip this end up concluding "we worked a thousand accounts and didn't close much more," when all that happened is they graded a data test on a sales outcome.
Trap 2 — Not agreeing on definitions before anyone tags. If you're manually reviewing, being extremely clear on definitions to the evaluating team (usually SDRs and AEs) matters.
Does "decision-maker phone number" mean a direct mobile that reaches the named person, or any number associated with the business?
Does a contact need to work at the company today and hold a role that can buy? Give the reps doing the tagging explicit rules, or they'll butcher the tags and you'll be measuring noise.
In many pilots we've seen both versions where a rep evaluates certain datasets as being high coverage for "Decision Maker Mobile", but are only measuring if the dial connects. This inflates the number as they may often be calling the phone number of the location and reaching gatekeepers.
In other cases, they may get sent to voicemail that matches the name of the owner, but they say that this is not a "Decision Maker Mobile" because they didn't end up talking to someone. This makes a data source look much worse than it actually is.
Trap 3 — Letting the builder grade their own homework. An internal team, or a vendor, will show better precision and recall when it validates on the same set it built on. Don't let internal teams train their pipelines on the golden dataset. Don't allow external teams to pick what accounts to share.
Trap 4 — Confusing coverage with correctness. Once the definitions are clear, you want to review the delivered data asset row by row. The most common way a source — or your own scraper — flatters itself is by counting a field as "present" when it is stale, mislabeled, duplicated, or attached to the wrong entity. We see the same gotchas repeatedly:
- The "decision-maker mobile" is the main business line. The mobile field was backfilled with the easiest phone number to find, so the rep still reaches a phone tree, front desk, or store employee. It only counts if it directly reaches the named person.
- The number works, but it belongs to someone else. A same-name match attached the wrong person, the number was reassigned, or the source connected the right person to the wrong business. A voicemail with a different name is a failed association, not successful coverage.
- The person is real, but the relationship is stale or irrelevant. They retired, changed jobs, sold the business, or hold a role that cannot make the buying decision. A valid person plus a valid number can still be an invalid contact for this account.
- The signal existed once, but is no longer live. A restaurant appears in delivery-app search results, so the source marks "uses delivery: yes" — but click through and the listing closed six months ago. Old website widgets, abandoned social profiles, expired job postings, and legacy software references fail the same way.
- Duplicates masquerade as additional coverage. The same person appears under name variations, several phone numbers, or every location they own. Ten returned contacts may represent three people — or one owner repeated ten times.
- The denominator excludes the misses. A provider receives 300 accounts, returns records for 170, then reports "100% coverage" across only the records it returned. Calculate coverage against the complete input set, at the account level, and report decision-maker names, direct mobiles, and verified mobiles separately.
Be prepared to run continuous testing
A clean pilot tells you the data is good today. It says nothing about next month, and roughly a quarter of local businesses turn over every year (§5). So be prepared to run automated and human spot checks in perpetuity if you are relying on data accuracy.
This needs to be budgeted. Continuous testing, in Emile's words, "is not free — that is an ongoing continuous cost," paid in people's time and expensive model runs.
Most pipeline monitoring answers a narrow question: did the job run? That is useful, but you need to be able to catch silent errors in situations where scrapers may complete successfully and returns half as much data as it did last month.
Some best practices for monitoring your datasets for drift:
- Expected-vs-observed shape checks. You roughly know how many pizza shops a market should have, so alert when the count deviates. And trigger targeted checks on the accounts most likely to be wrong: when an account crosses, say, 50 locations, auto-audit the rollup rather than waiting to be told it's inflated.
- Have a clear alerting system. A failed ingestion should retry, alert someone, or stop its output from reaching production. It should never pass an empty result downstream as if the source had nothing to report. The internal standard is straightforward: "when our ingestions that we expect to run without issue are broken … we know right away."
- Expected-hit-rate monitoring, not static thresholds. A low data-fill rate on a thousand tiny no-web-presence businesses is normal; the same rate on well-known accounts means something broke. Static thresholds can't tell those apart, so you model the expected hit rate per account and alert on deviation from it.
- Error attribution by source. When accuracy slips, the first question is which verification source is causing it, because the slice of your data whose error rate you actually know is always smaller than you'd like. Attribute the error and you can drop or fix the offending source quickly.
- Have human spot checks, and turn every catch into a permanent test (spine layer 3). What a person finds in a spot check doesn't get fixed once and forgotten — it becomes a new rule and a new entry in the golden set, so that exact failure can't slip back in unnoticed.
- You can programmatically verify phone numbers: Part of continuous monitoring systems should be programmatic tests to verify that numbers are valid, using services like Twilio and Trestle.

Data pipelines that rely on AI need to re-test on new model releases
With new models being released and deprecated constantly, teams relying on LLMs at any point in their pipelines need to constantly be checking the output of their pipelines. Model changes can be unpredictable, with new models requiring refreshed prompts.
Additionally, new LLM models can offer significant cost benefits. Our team internally is always testing whether new models can offer higher accuracy, or similar accuracy at lower costs.
[Source: patterns from DataLane's production pipeline — automated match adjudication, contact-yield alerting, an enrichment eval harness, and baseline-diff regression. Implementation specifics (models, signals, thresholds, taxonomies) withheld pending secret-sauce review.]
The best test: Ridealongs
Have your RevOps team shadow your best BDR for a day every month or quarter. See if they are using the data that you are delivering to them. Their feedback is the best indicator of whether your investment is paying off.
7. The true cost of building a TAM and Contacts dataset
To write this section, I jammed with Emile Flavin, the BizOps member of our team in charge of costing and refreshing our TAM and Contacts datasets.
Reviewing our invoices, our team is projected to spend over $2M on technology spend (infrastructure, API credits, LLM tokens) in 2026. These are actually optimized costs that our engineering team has driven down significantly over the last two years.
In addition, we have another 5 FTEs in the engineering and BizOps teams who spend the bulk of their time fully dedicated to maintaining and delivering the dataset, with different engineers pulled in to support special projects where we want to add in a new signal or optimize costs.
The upfront cost to build any project related to your GTM data foundations is just a small portion of Total Cost of Ownership. Maintenance and ongoing costs will drive the bulk of the cost!
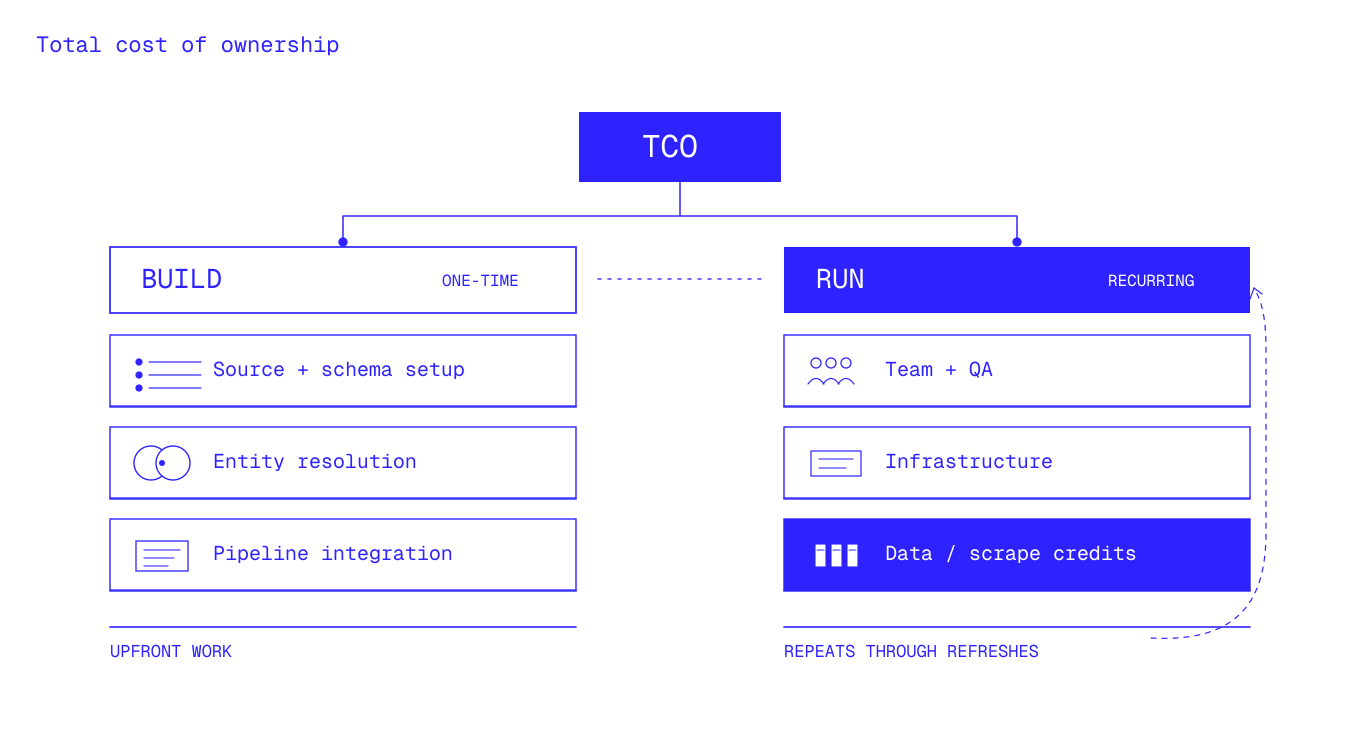
You will need the support of your engineering or data team to estimate costs, and we try to provide heuristics and vendor pricing calculators to make it easier.
Fun facts
Contacts: In March, 2026, DataLane spent over $20k on OpenAI credits and Twilio credits alone to do work related to delivering Contacts (names, emails, mobile numbers) across all our customers, and these are optimized costs that we've spent 2+ years driving down. This represented only a portion of our total credit-based costs related to our Contact pipelines.
TAM: Acquiring the data via scrapers and 3rd party sources only took up 30% of overall tech spend. The remaining tech spend was on infrastructure (GCP, Neon, Turbopuffer, Snowflake) and credits (OpenAI), related to storing, manipulating, and verifying the data.
If we examine FTE and headcount required to maintain this dataset at a level of "usable by a sales team" and deliver it to business users you could make a credible argument for at least 3, but in a slower moving / less talented org eng count and Bizops count will likely be higher also
Here's the model that we use to estimate our costs.
Explaining the model
Build: Everything in the initial work required to build the infrastructure needed to process and manipulate the core dataset. Mostly headcount combined with
Run: The cost of actually starting the pipeline and getting usable data. This includes the first run. Categorizing this as “maintenance” is also accurate, but we use “run” as the costs are directly tied to how often you want to run and refresh the pipeline vs a fixed, ongoing maintenance cost.
For every line item, I try and add as much context as possible and benchmarks
Line Item
- Factors that affect the calculation and model
- The mental model to calculate the associated cost
BUILD
Headcount
Rather than mandating a certain number or ratio for your team (every org is different), I would rather break out some of the core tasks associated with building out a TAM and Contacts dataset, and allow you to determine how many people will be needed to fulfill those core obligations.
Here are the tasks the project team will need to deliver on:
- Reading API documentation for various data providers
- Understanding and architecting the optimal database schema to store output
- Scoping the needs of business users in Sales and Marketing
- What columns are needed?
- What target precision and recall do we need to hit?
- What verticals do we focus on?
- Sourcing and negotiating with third party data vendors
- Building the golden dataset
- Testing and verifying the accuracy of third party data and scrapers
- Designing and testing the core data pipelines
- Matching and deduplication
- Error handling
- Precision and Recall measurement
- Creating your evaluation framework
Usually these tasks are completed with a mix of the engineering and RevOps team.
Engineering focuses on building a scalable, repeatable pipeline and the infrastructure.
RevOps is focused on the data source evaluations, negotiations, delivery to GTM, and gathering feedback.
Formula:
Headcount * Salaries
Data
For the dataset that you’re looking to build, are there fixed monthly contracts that you will need to sign to get access to the data you need? Include any projected monthly or annual costs associated with data contract here, and save any credit based costs for the “Run” section.
Formula:
Data provider annual contract cost
RUN
The variable costs to Run your data pipelines are incurred as a function of your refresh frequency and the size of the universe you’re looking to deliver.
For the credit based portions of this system, the best approach is estimating the credit consumption needed per run with your engineering teams through a small pilot of 500-1000 accounts then multiplying by your refresh frequency to determine your annual costs.

Headcount
To achieve high reliability and ensure that the data is being used, you will need to have a dedicated team focused on the operations around running and improving the data pipelines.
Here’s how it looks on our team:
- Alison, Christian: Fielding business requests, Slicing the relevant portions and “deliveries”, Access management
- Matt: Maintaining and monitoring the infrastructure, building new pipelines (in case we want to add more signals, new strategies), cost optimizations
- Emile: Testing new strategies to identify signals, managing vendor relationships, spot checking data quality
Formula:
Headcount * Salaries
Credit based costing
Each run incurs costs by consuming a set number of credits or tokens per record processed. The broad categories of credit-based consumption are:
Data Infrastructure
You need to store the raw inputs, intermediate stages, and final output of your data pipelines somewhere. These should be factored into the cost of each run.
Keep in mind that the data pipelines you are about to build write like a swarm, with millions of concurrent updates that need to be coordinated. You want to write data where writes are cheap (Neon), replicate once in efficient batches (Estuary), serve analytics where scans are cheap (Snowflake).
As a benchmark, this costs us over $400,000 annually. We’ve optimized these costs heavily, but they are also higher than average given the size of the dataset we maintain across all our customers.
You largely pay for three things in the infrastructure required:
Storage — the storage unit
You pay rent on every record you keep, every month, whether they are used or not.
Like a self-storage unit or your iCloud photo bill: it doesn't matter if you looked at the photos this month — you pay for keeping them, and the only way the bill goes down is deleting things.
Storage is more expensive in different providers. Data kept in a database like Turbopuffer rents at ~100x the rate.
What makes it grow: keeping more records, and forgetting to throw things out. Not usage.
Compute — the taxi meter
You pay for machines being switched on, by the minute — not for the work they do.
Like a taxi: the meter runs while it idles at a red light just the same as on the highway. Or a contractor who bills for every hour on the clock, not per task completed.
What makes it grow: adding another always-on process, or upgrading to a bigger machine. Not more queries, not more data.
Movement — the toll booth / shipping bill
You pay by the pound, each time, only when goods cross a border.
Like freight shipping: owning the inventory is one cost (storage), but every time you truck it to another state, you pay per box, per trip. Ship the same pallet weekly and you pay the toll weekly.
What makes it grow: how often you move things and how much crosses a border each time. Refreshing customer data weekly instead of monthly = 4x the tolls on the same data.
Formula:
You will need to involve an engineer to support and estimate costing, as it varies drastically based on how they plan to design the data pipelines.
We have linked pricing calculators for services that we use.
You could also comfortably assume that it will cost at least $5,000 monthly across these services to achieve a target precision level of 95% on a TAM dataset within a single vertical.
Pricing calculators:
Scraping Credits
Third party scrapers like Clay and FireCrawl have scraping services that charge on a per credit basis to scrape the open web.
There is often a significant premium for these services as they are rarely complete, require deduplication, and must run through further cleanup to become usable.
To get a cost estimate, we recommend running a trial of your scraping workflows on 250-500 accounts. Determine the average credit usage across this sample, then you can extrapolate.
Perform a costing exercise for each signal and column that you are relying on these scraping services for.

It would be a mistake to project your “credits per record” by only tracking the credits used to get a business website without including the credit costs associated with sourcing other columns such as social media profiles, review counts, POS, reservation provider, FSM provider, or any other signal that is relevant.
Formula:
For each signal requiring a dedicated scraper: average credit usage * cost per credit * # of records
Contact information verification APIs
You need to verify the contact information your pipelines surface before they are given to your reps. Every wasted dial is extremely expensive downstream.
You can use services like Twilio to accomplish this.
Formula:
For each service used: API pricing per call * Number of Contacts * # of calls per contact
LLMs
LLMs are used as a flexible tooling that supports matching and deduplication, address verification, content extraction, and more.
In a cost-optimal scenario, you will be using different LLMs for different levels of task complexity. There’s no need to be using Claude’s Fable 5.1 when the Haiku model has 95% of the quality at 10% of the cost.
Similar to scrapers, build a sample pipeline to determine your cost per record for each.
Formula:
For each stage LLMs are used = records touched × judgments per record × price per judgment
QUALITY MODIFIERS AND CONSIDERATIONS
How long will it take for you to build?
- Does that timeline line up with the revenue targets your org is expected to support in delivering?
What happens if a key member of your “Run” team leaves?
- If only one person understands the system and they leave, is your team able to run your data pipelines without them?
How much accuracy can you sacrifice before reps just stop using the data?
- There is always an accuracy floor that teams will need to hit on TAM and Contacts, and if you sacrifice accuracy for the sake of speed or cost, reps will not trust the data. They will start manually researching and your org will not see any efficiency gains or lifts in demos.
Benchmarks
Here are the approximate number of deduplicated accounts that we can detect by vertical:
Note that to discover these records, your team will have to process an order of magnitude more in their data pipelines before they are deduplicated.
- Home Services: 3M+ Accounts
- Beauty and Wellness: 1.25M+ accounts
- Healthcare: 1M+ accounts
- Restaurants: 1M+ accounts
- Retail: 1.75+ accounts
Precision target:
Aim for 95% precision on TAM and Contacts.
Recall
For fields that are publicly and reliably available, we can achieve 90% recall. One example of this field would be restaurant reservations. Some signals are inherently lower recall such as POS and FSM software, which have fewer public giveaways.
See a build calculator here: most recent build vs buy
