The Canonical Guide
to Selling to Restaurants

What You'll Find Inside

This guide is for GTM leaders at companies that sell to restaurants. It’s filled with hard-won insights from our work with DoorDash, Square, Paychex, Olo, Restaurant365, Owner and dozens of other companies trying to reach restaurant owners not on LinkedIn.

The core insight: Ninety-nine percent of B2B GTM infrastructure was built for buyers who are on LinkedIn and spend their days at a desk responding to emails. Apply that same playbook to restaurant owners, and it fails almost every time.

This guide provides frameworks, economics, and benchmarks for teams so they can build sales motions that actually work.

Key Stats That Matter
Stat
What it means
Section
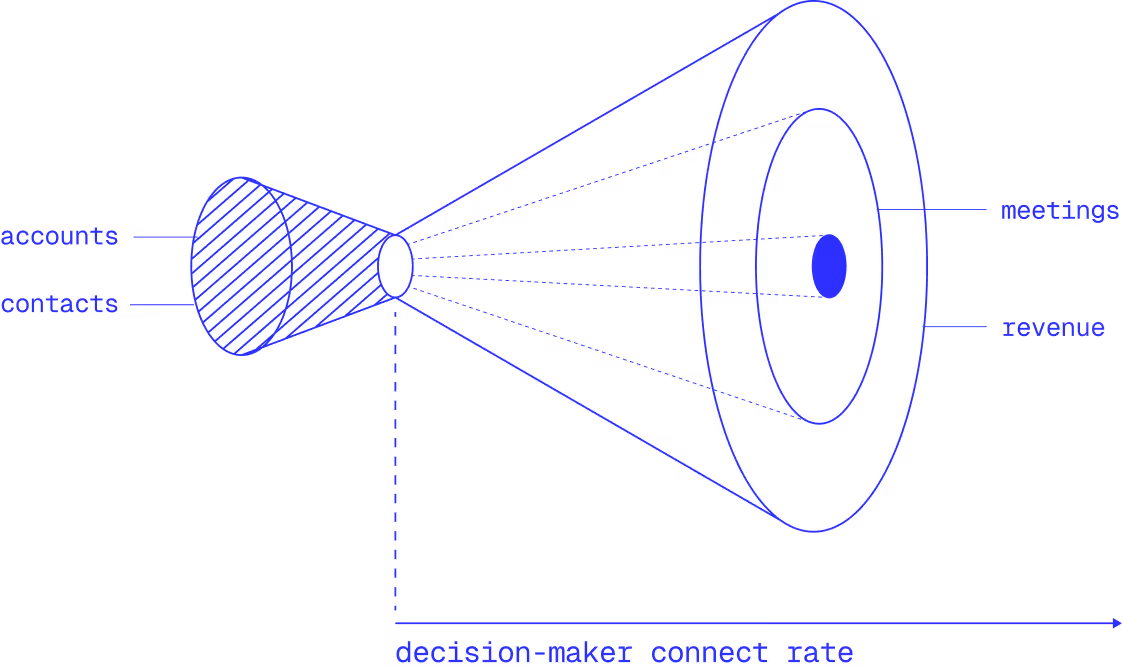
DM Connect Rate: 3% → 16%
Owner.com connect rate improvement achieved by fixing data foundations
Mobile Number Coverge:10-20% -> 50-60%
ZoomInfo mobile number coverage for restaurant owners vs best-in-class
TAM turnover:17% per year
Restaurant closure rate; your CRM decays this fast
ICP Accounts: 5,000 → 1,200
A "5,000- account territory" after filtering for workable accounts
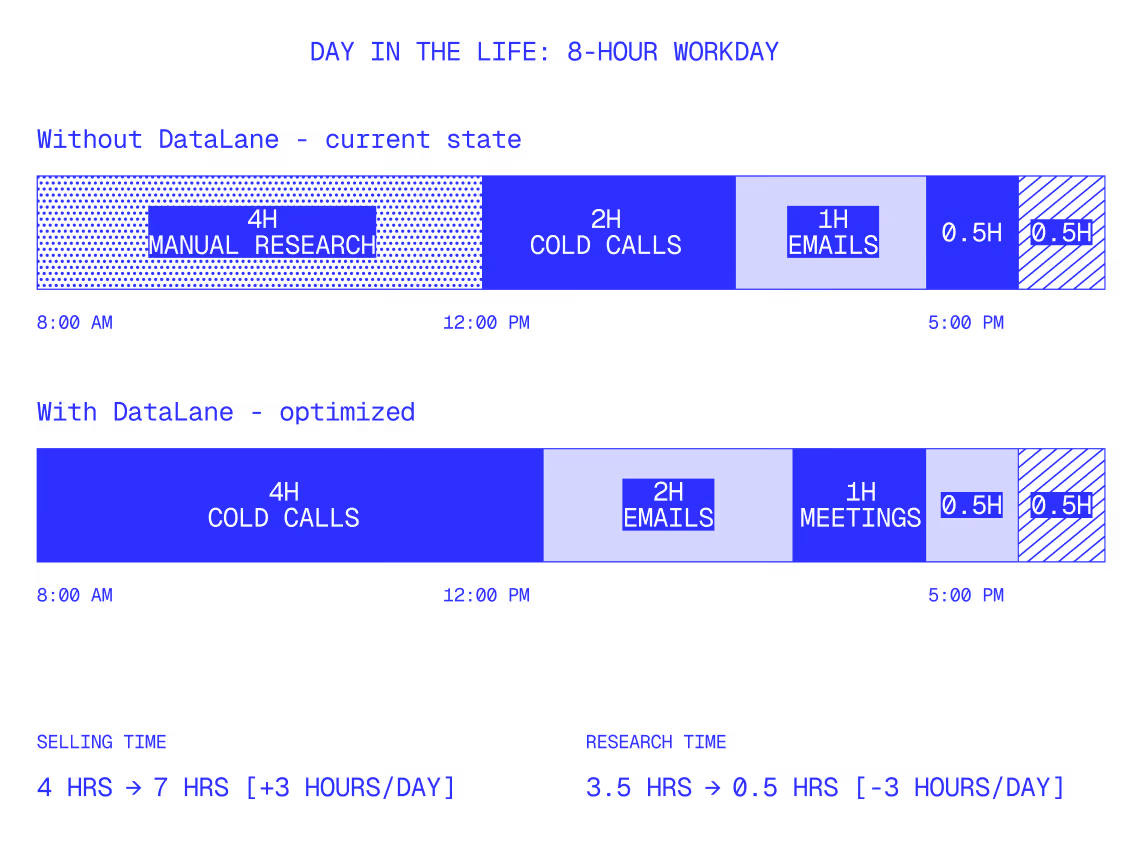
Time spent on research:20-30%
Time reps spend researching instead of selling without a data layer
If you're in GTM Strategy / Leadership
1.10
/

Why Traditional GTM Fails: The three gaps framework

1.7
/

The Data Layer: What you're building around when you lack data infrastructure

1.4
/

Compensation Benchmarks: The cost of restaurant GTM teams

If you're in RevOps / Sales Ops
1.8
/

Territory Design: Why your territories are unbalanced and how to fix it

1.10
/

GTM Benchmarks: Target metrics for connect rate, coverage, DQ rate

1.9
/

GTM Stacks: CRM vs warehouse architecture for restaurant TAM

If you're a Sales Leader
1.4
/

Restaurant Signals: Qualification vs timing signals for prioritization

1.2
/

Field Sales Economics: When field vs inside makes sense

If you need to make a case internally
1.4
/

The One-Page Diagnostic: Two-hour exercise to quantify your gaps

1.2
/

The Data Layer: The cost of not having infrastructure (with math)

The Three Gaps Framework
Traditional B2B GTM fails for restaurants across three dimensions. Most teams focus on #3 but ignore #1 and #2:

Your ACV can't support your sales motion.

Start here →

You're calling accounts that won't convert. ‍

Start here →

You have the right accounts but can't contact them.

Start here →

Section 1.11: The One-Page Diagnostic helps you assess all three gaps in under 2 hours.

Four Insights Worth Reading

Your "TAM" is probably 75% phantom accounts, disqualify during territory creation
Five thousand accounts can shrink to 1,200 workable ones within a territory after you filter for closed businesses, missing contacts, and unserviceable accounts. If you're setting quotas against the raw number, you're setting reps up to fail.
Decision maker connect rate is the most important upstream metric
Your ability to reach decision makers is a bottleneck impacting every downstream metric (meetings booked, pipeline generated, deals closed).

In trying to measure this, most teams consider every phone number as equal. Business phone numbers, however, rarely get you on the line with decision makers. Per our data, main line connect rates of 3–7% are drastically lower than owner mobile connect rates of 12–18%. Double your connect rate, and you double the efficiency of your entire org.
You’re wasting your GTM talent on non-revenue generating activities
BDR teams whose real job is research, not selling. Engineers building dedupe pipelines instead of product features. RevOps spending their time stitching CSVs. Each hire solves an immediate problem while cementing the absence of infrastructure as permanent.
Refreshing GTM data for restaurants is a core RevOps competency
Seventeen percent of restaurants close every single year. That means by default, 17% of accounts in your CRM become unworkable on an annual basis—which has severe implications on territory design and rep efficiency. You need to constantly refresh data with new accounts, remove closed businesses, and ensure your data provider isn’t selling a stale list from 2020.

How to Use This Guide

If you have 15 minutes

Read the Four Insights above.

If you have 2 hours

Run the One-Page Diagnostic to quantify your gaps.

If you're building a business case

Start with The Data Layer for the cost of inaction, then Benchmarks for targets.

If you're redesigning your GTM motion

If you're redesigning your GTM motion: Read sections 1.1 → 1.6 → 1.8 → 1.9 in order.

Quick Reference: Benchmarks
This guide is based on patterns from working with GTM teams at DoorDash, Olo, Restaurant365, and dozens of other companies selling to local businesses.

Full benchmarks with context: Section 1.10