Burger King is on a roll, and that makes it a pretty tempting account to chase. But while customers are coming back, hundreds of restaurants are moving back into franchisee hands, which means the company you thought owned a location today may not own it tomorrow.
For sales teams, that shakeup can create new accounts, new decision-makers, and new reasons to call, if you can tell what’s actually changing. Datalane’s data shows us how to separate the real opportunities from the noise.
Key takeaways
- Burger King’s comeback and its ownership shakeup are happening at the same time.
- Where refranchised restaurants end up matters as much as the fact that they’re changing hands.
- The store map isn’t the sales map.
- An ownership change isn’t automatically a sales opportunity.
- The valuable signal is knowing what changed behind the record.
Act 1: The comeback
Before we dig into the sales and data component of Burger King’s latest success and paradoxical franchise shakeup, we have to look at how they’ve managed to land so many punches lately.
Burger King succeeds with quality, branding, and enthusiasm
Comparable U.S. sales for Burger King jumped up 8.5% in Q2 of 2026. Even better, the brand outperformed the burger quick-service restaurant (QSR) category by more than nine points.
This isn’t a random bump, an accident, or a market fluctuation. The improvement directly follows years of an ambitious “Reclaim the Flame” investment in operations, advertising, restaurant upgrades, and franchisee health. Burger King put money into kitchen equipment and restaurant technology, elevated the Whopper and built out its Royal Crispy Chicken lineup, while its newer “Sizzle” restaurants added ordering kiosks, dedicated mobile pickup areas, improved drive-thru flow, and more efficient kitchens.
Burger King U.S. and Canada President Tom Curtis summed up the “why” of their upgrade with a simple read on the psychology of a franchise owner: “If you can get the franchisees making more money, they’ll put it back into the restaurants. These guys and girls who have been in the business for 30 or 40 years, ketchup in the veins, they love the brand.”
Reinvestment and relocation
So we have a comeback everyone can see, and yet RBI is unwinding the Carrols portfolio it bought in 2024. It expects to refranchise a few hundred restaurants in 2026 and the remainder in 2027, while its potential buyer pool has more than doubled since investor day. Its recovery is happening just as the ownership map undergoes a massive sea change — and your point of contact might not be who you think they are.
Act 2: The ownership shakeup
Right as Burger King starts looking more attractive than it’s been in years, Restaurant Brands International (RBI) is putting hundreds of restaurants back into franchisee hands. The sales opportunity depends on where those restaurants land, because the same reshuffle could create new accounts, expand existing ones, or concentrate even more locations under Burger King’s largest operators.
Nearly 1,000 Burger Kings are entering an ownership reshuffle
Datalane maps 6,805 active Burger King restaurants to just 493 owner accounts. Carrols is the largest with 991 locations, followed by Dhanani at 527, and GPS Hospitality at 372. Datalane is already seeing possible movement: Carrols fell from 1,002 locations in June to 991 in August while Burger King’s owner-account count rose. The system is becoming more fragmented as refranchising gets underway.
Where those restaurants end up could change the shape of Burger King
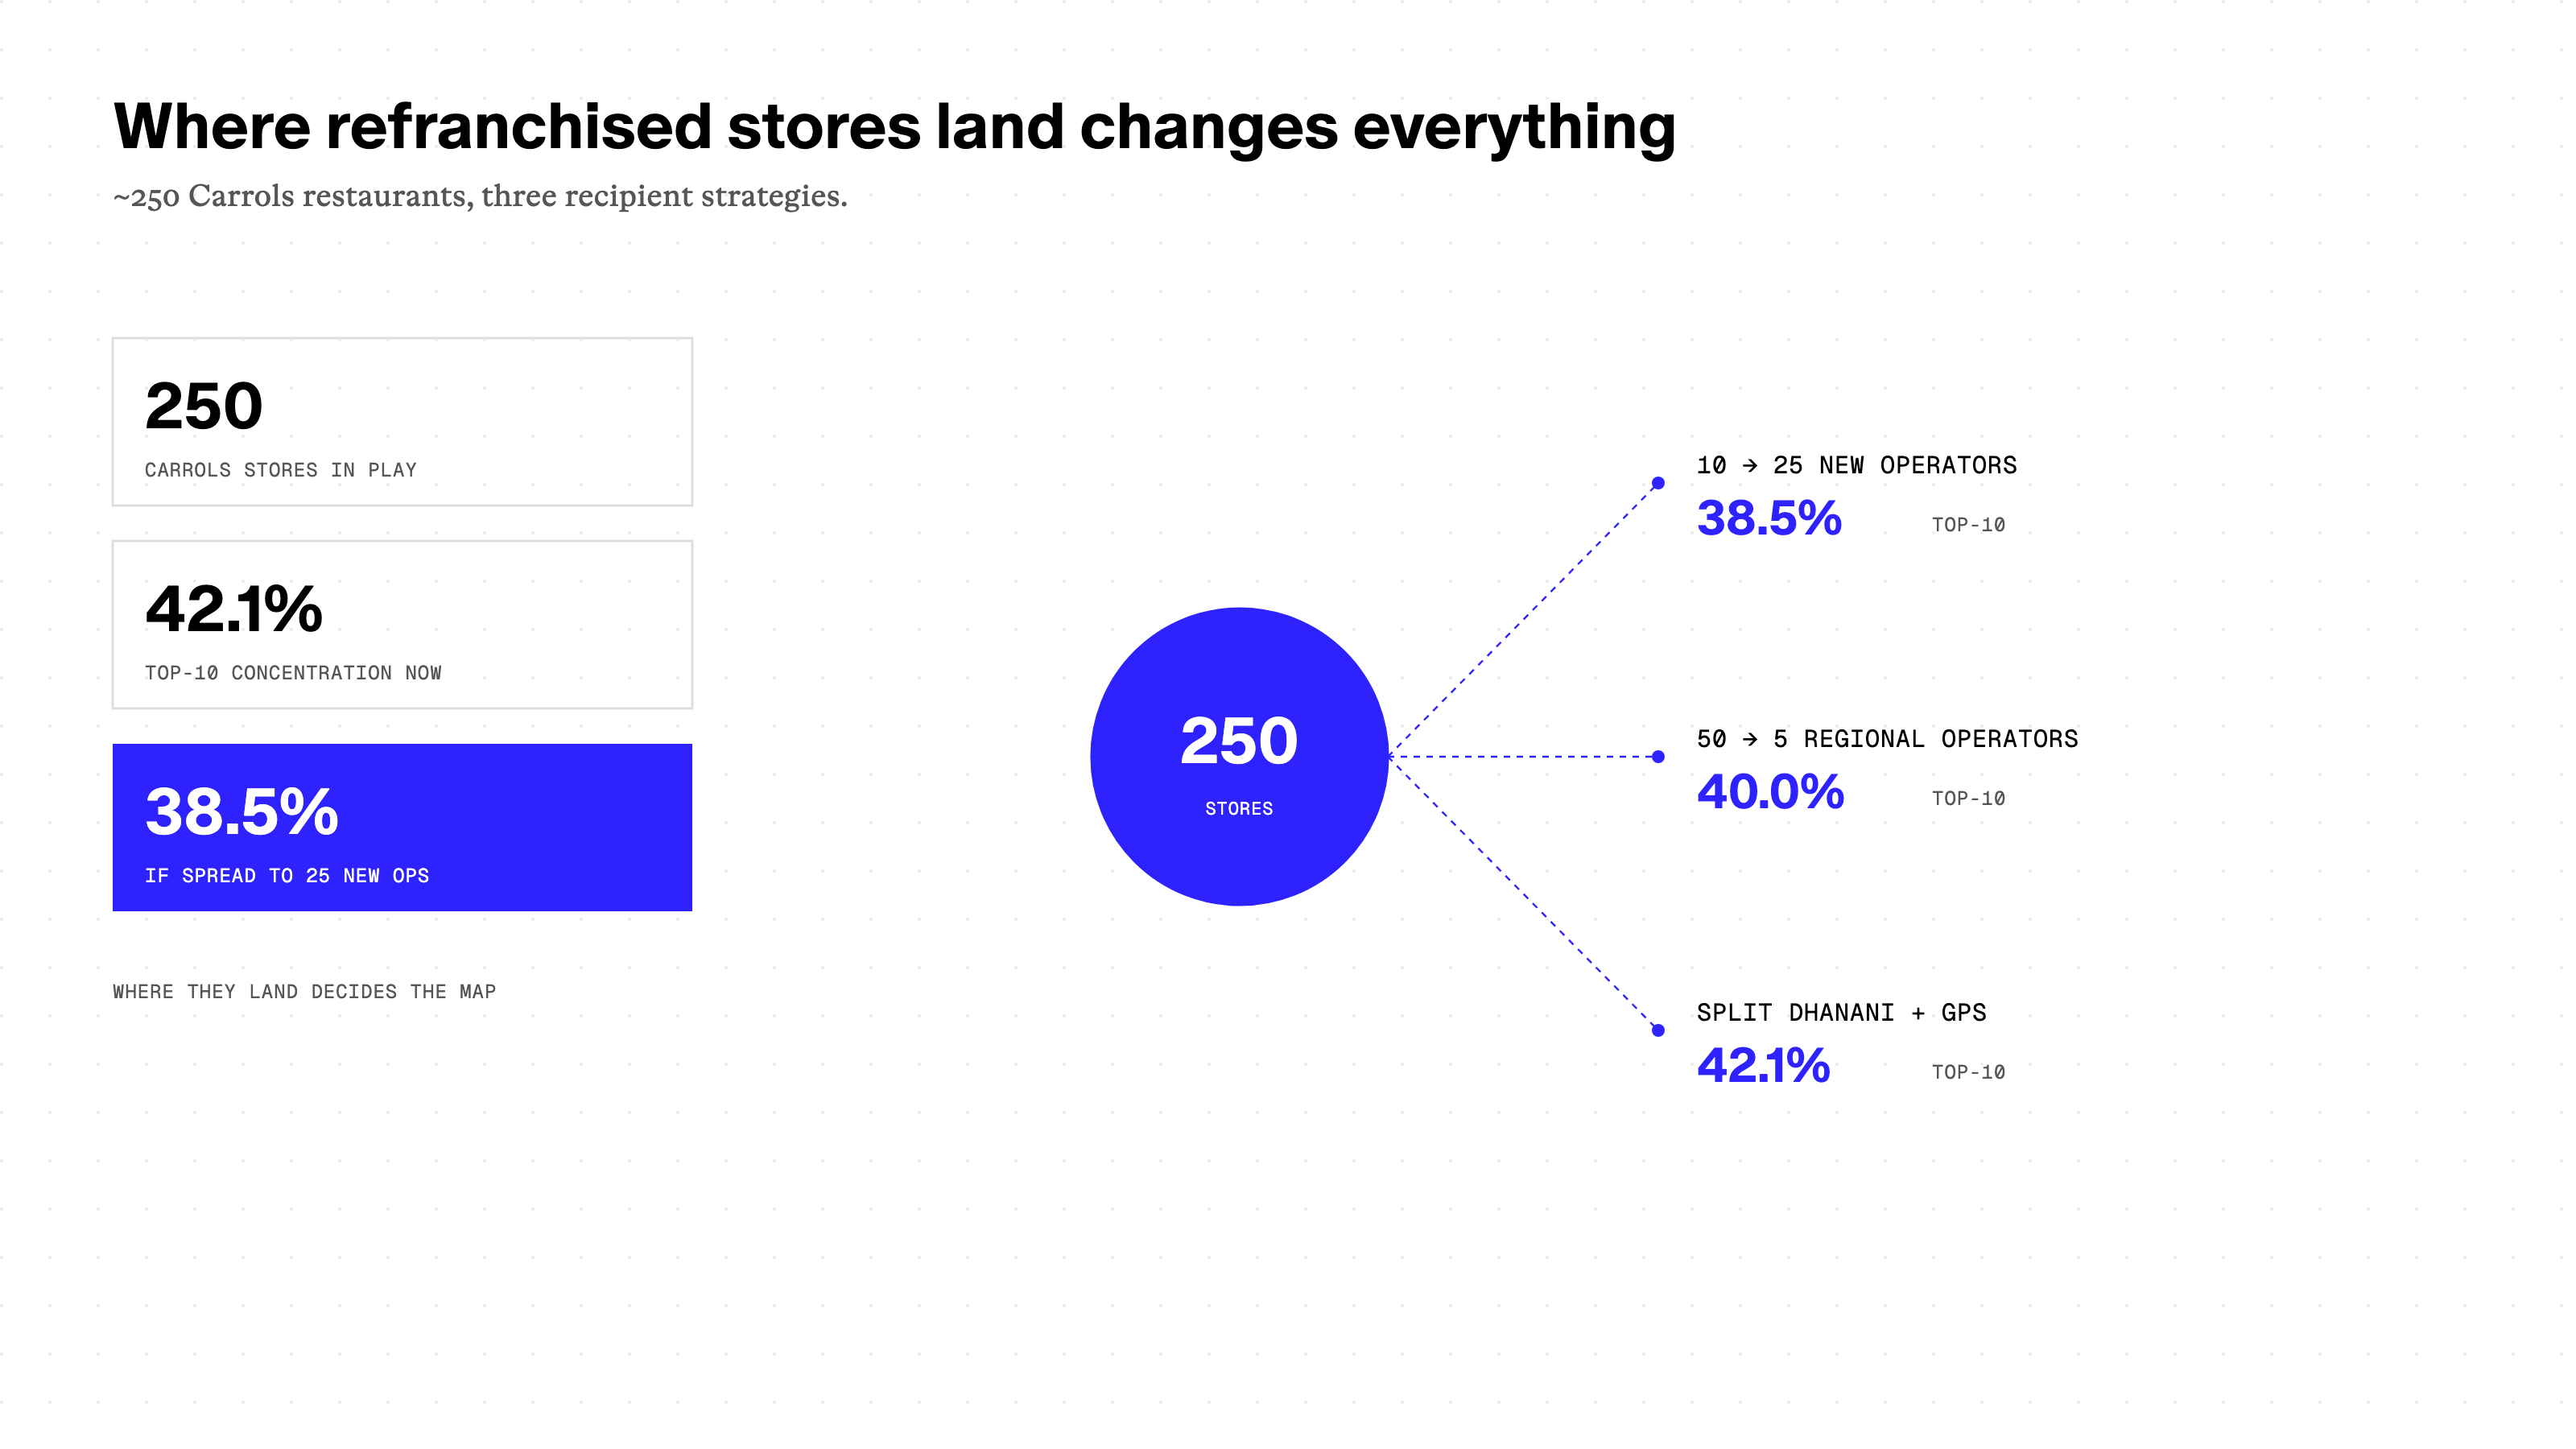
Refranchising doesn’t automatically decentralize Burger King. Who gets the restaurants determines whether ownership spreads out or existing operators simply get bigger. Datalane modeled the same hypothetical 250 Carrols restaurants three ways:
- Giving 10 restaurants each to 25 new operators drops Top-10 concentration from 42.15% to 38.47%.
- Giving 50 restaurants each to five existing regional operators produces 39.99%.
- Splitting all 250 restaurants between Dhanani and GPS leaves Top-10 concentration unchanged at 42.15%.
Datalane’s proximity analysis finds IRMG within 25 miles of 162 mapped Carrols locations, Applegreen near 145, and Eyas near 98. That shows how many Carrols restaurants already sit near an established operator that could absorb them into an existing footprint.
Act 3: The account map hiding behind the store map
Burger King’s store map and its sales account map are two very different things. Datalane’s data shows thousands of locations collapsing into hundreds of buying organizations, many of which cross the geographic boundaries sales teams typically use to divide their territories.
Burger King has thousands of restaurants, but far fewer buying organizations
Forty percent of Burger King owner groups have exactly one restaurant, but they collectively control only 2.9% of locations. Just 23 groups with 51-plus restaurants control 55.5%. The Top 10 control 42.15%, the Top 25 control 56.91%, and the Top 50 control 69.54%.
When you map every storefront to the company that actually operates it, the list collapses. In an August 26 analysis, Datalane resolved 6,805 active restaurants to just 458 high-confidence organizations — about 15 restaurants per company — by matching related entities through shared executives, operator websites, and Datalane entity links.
That collapse is where the real concentration shows up: once storefronts roll up to the companies behind them, the Top 10 organizations control 43.8% of locations and the Top 50 control 71.7%.
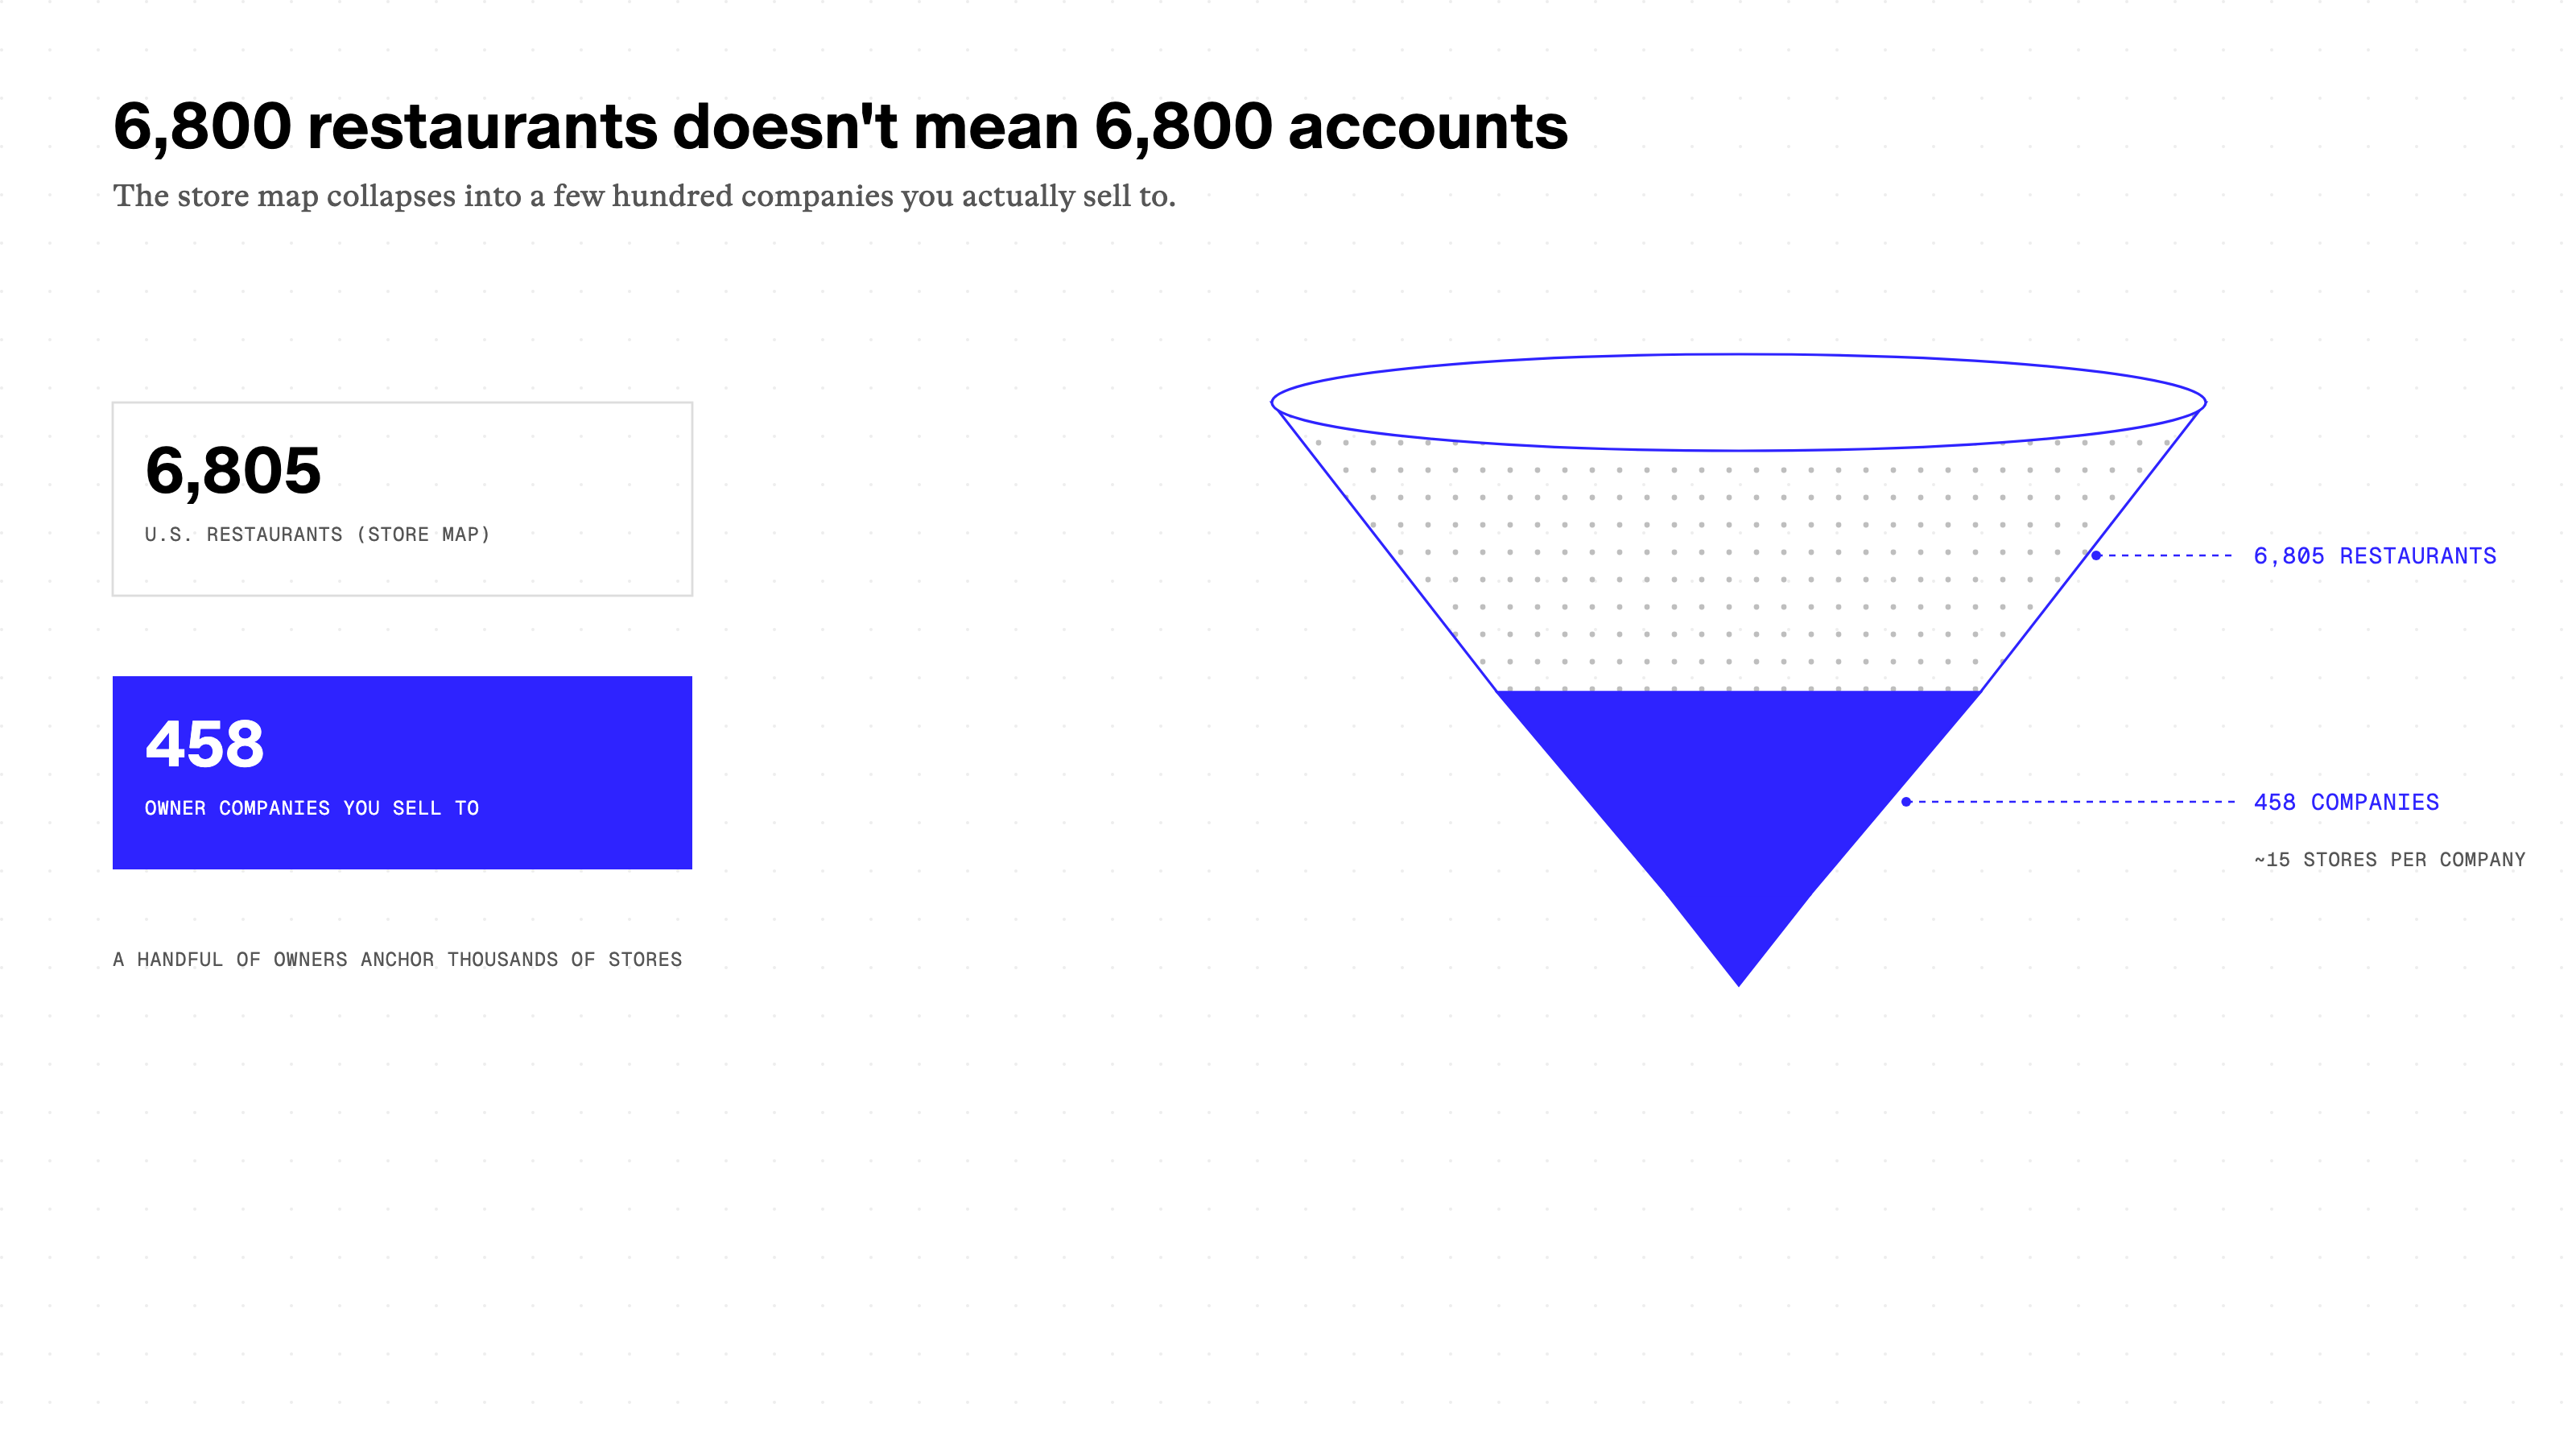
That turns thousands of storefronts into hundreds of organizations a sales team may actually need to understand and get in touch with.
Your geographic sales territories probably don’t match the ownership map
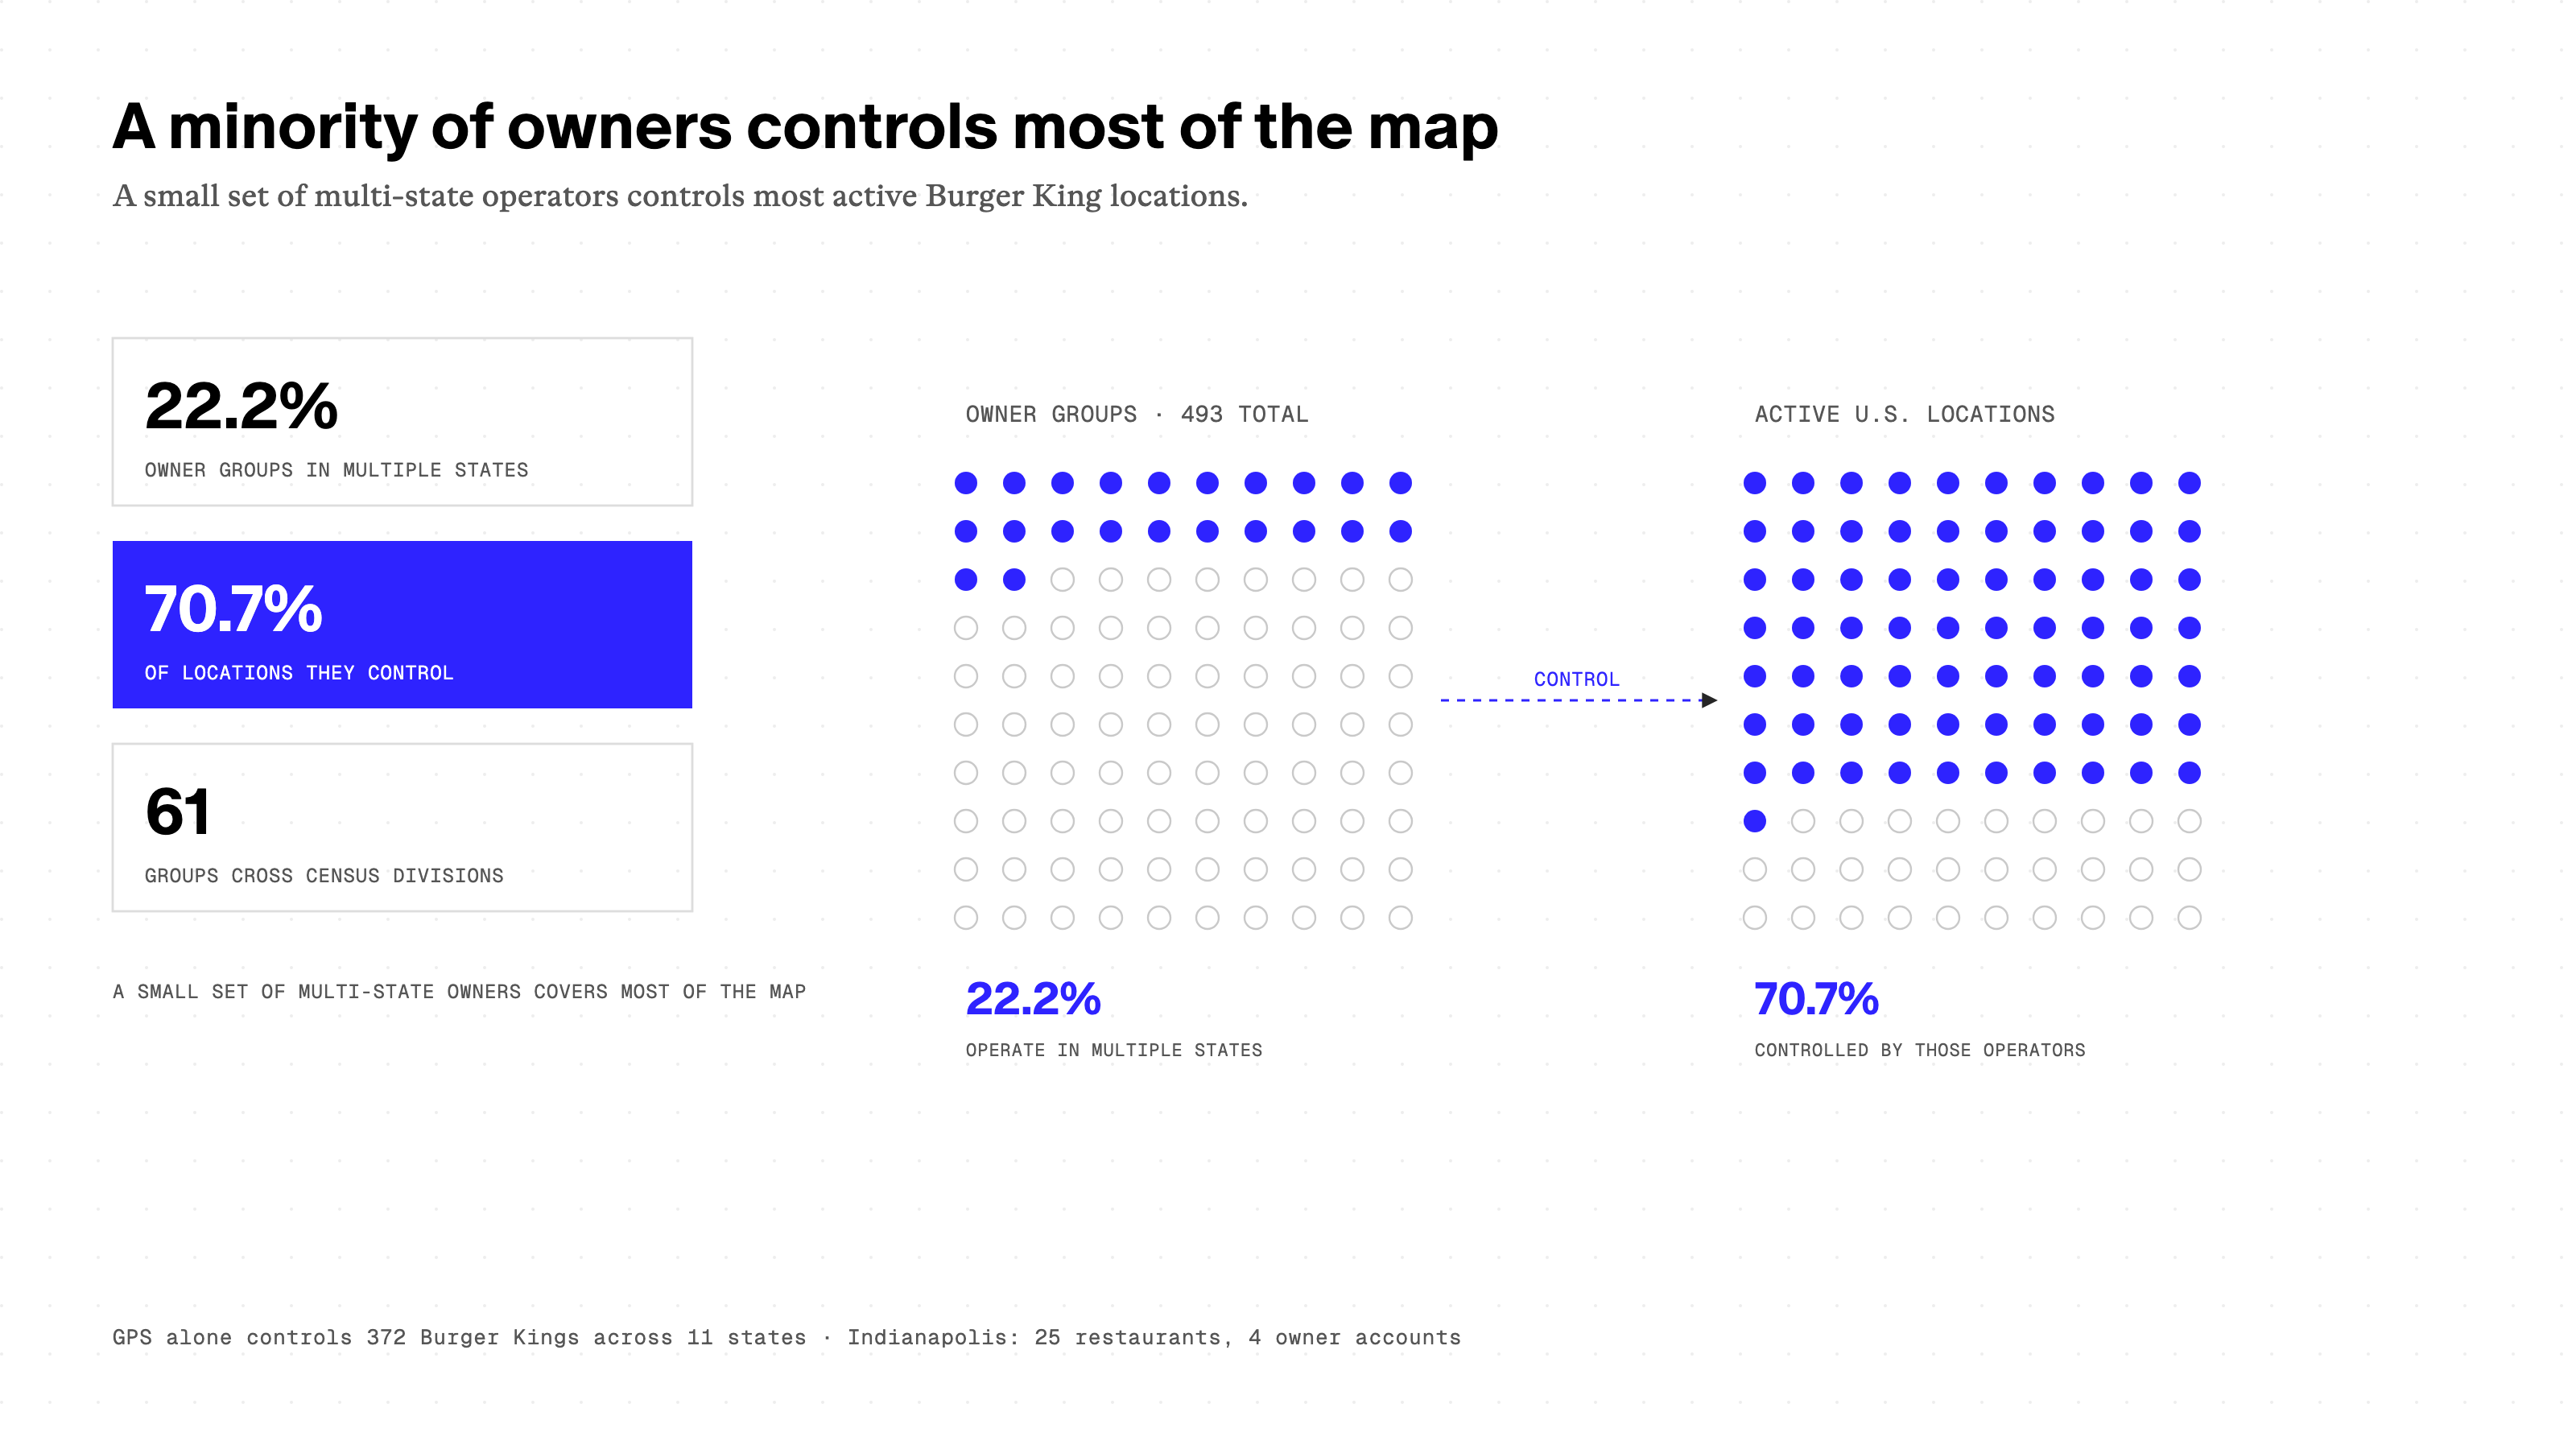
Only 22.2% of Burger King owner groups operate in multiple states, but they control 70.7% of active locations. Sixty-one groups cross U.S. Census divisions and control 56.6% of locations; GPS alone controls 372 Burger Kings across 11 states. The reverse problem pops up inside cities. Datalane’s data shows that Indianapolis has 25 Burger Kings but only four owner accounts, with Carrols controlling 20. Philadelphia has 18 restaurants across eight owners.
Act 4: The signal problem
Here’s the problem we’re getting at: an ownership change looks like a sales signal, when it often isn’t. Raw ownership changes aren’t enough for a sales team to act on. The useful signal is knowing what actually happened behind the record.
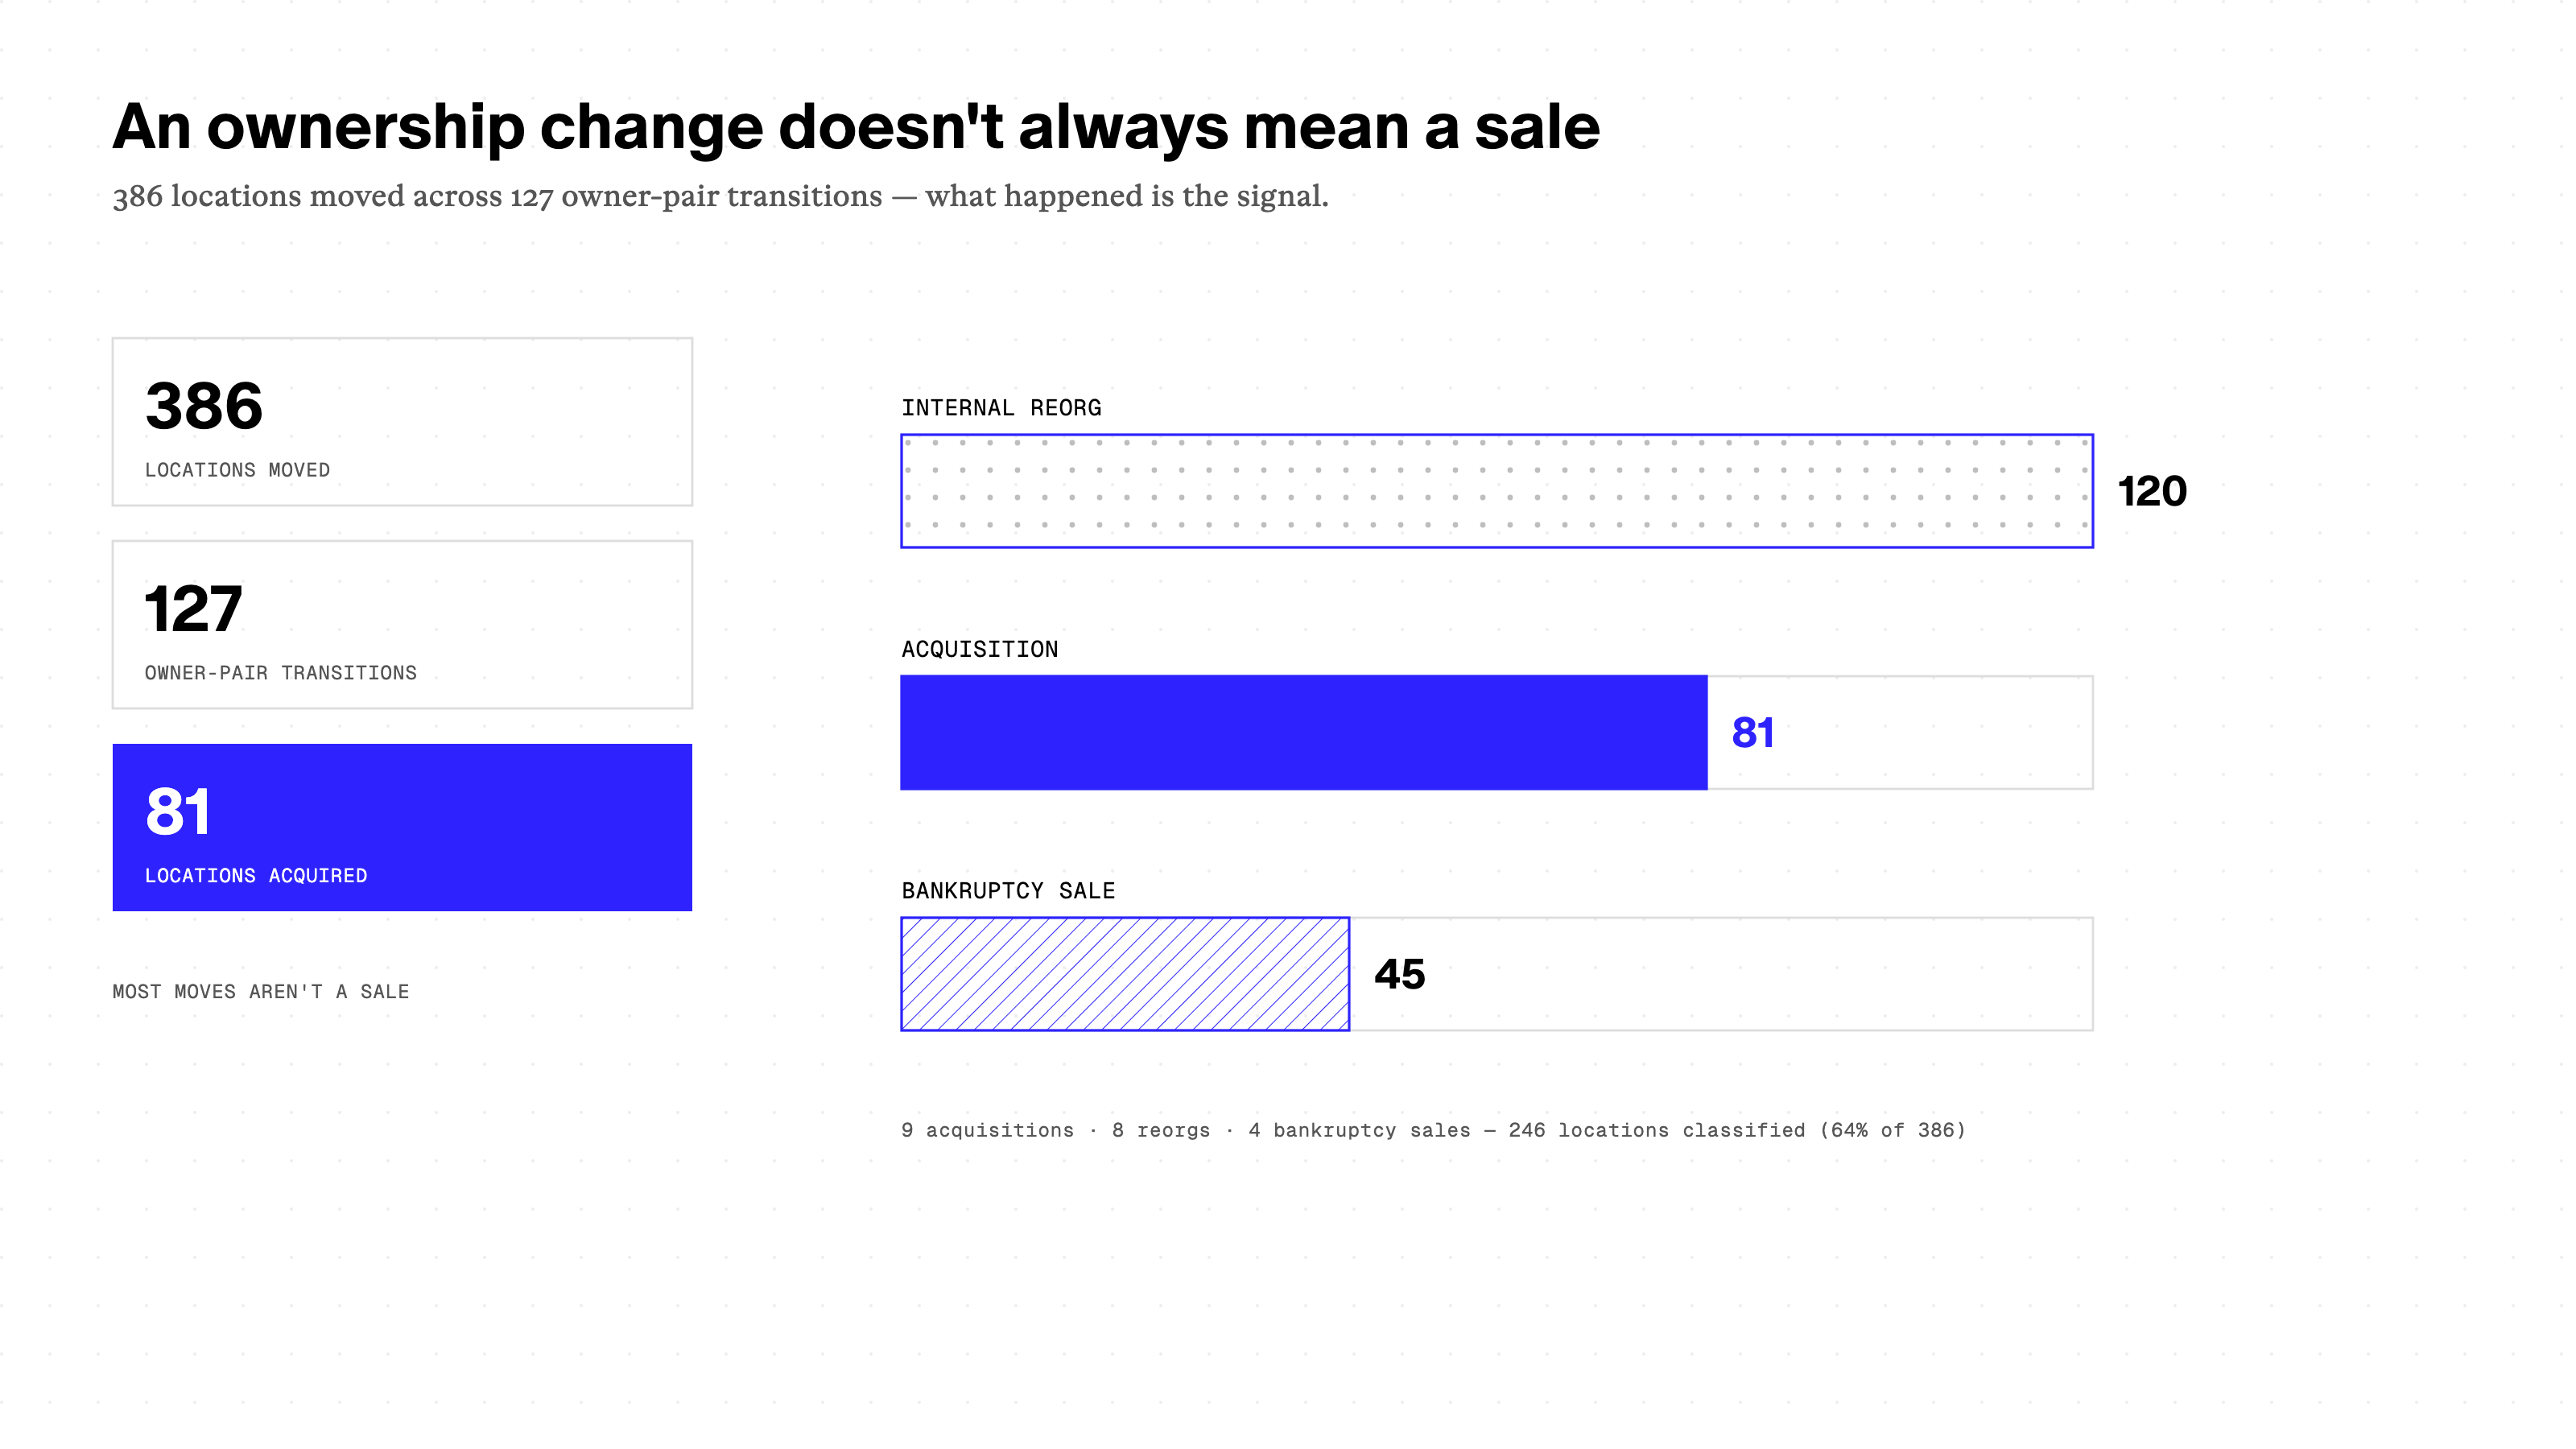
Datalane’s August 26 history pull found 386 locations changing hands across 127 owner-pair transitions. It classified every transition involving two or more units, covering 64% of moved locations. Nine pairs were acquisitions covering 81 locations. Eight were internal reorganizations covering 120. Four were bankruptcy sales covering 45, and one remained unknown. The biggest single move wasn’t a sale at all: Kevin Newell to Newell-Berg Alliance shifted 34 units, but Datalane found the same principal behind both entities and classified it as an internal reorganization. Those are different reasons to call, different people to call, and sometimes a reason not to call at all.
Act 5: Turning franchise data into sales intelligence
The real sales signal starts after the ownership change
Franchise data becomes useful when ownership changes are confirmed, classified, and connected to changes in the actual buying organization. The practical sequence is simple:
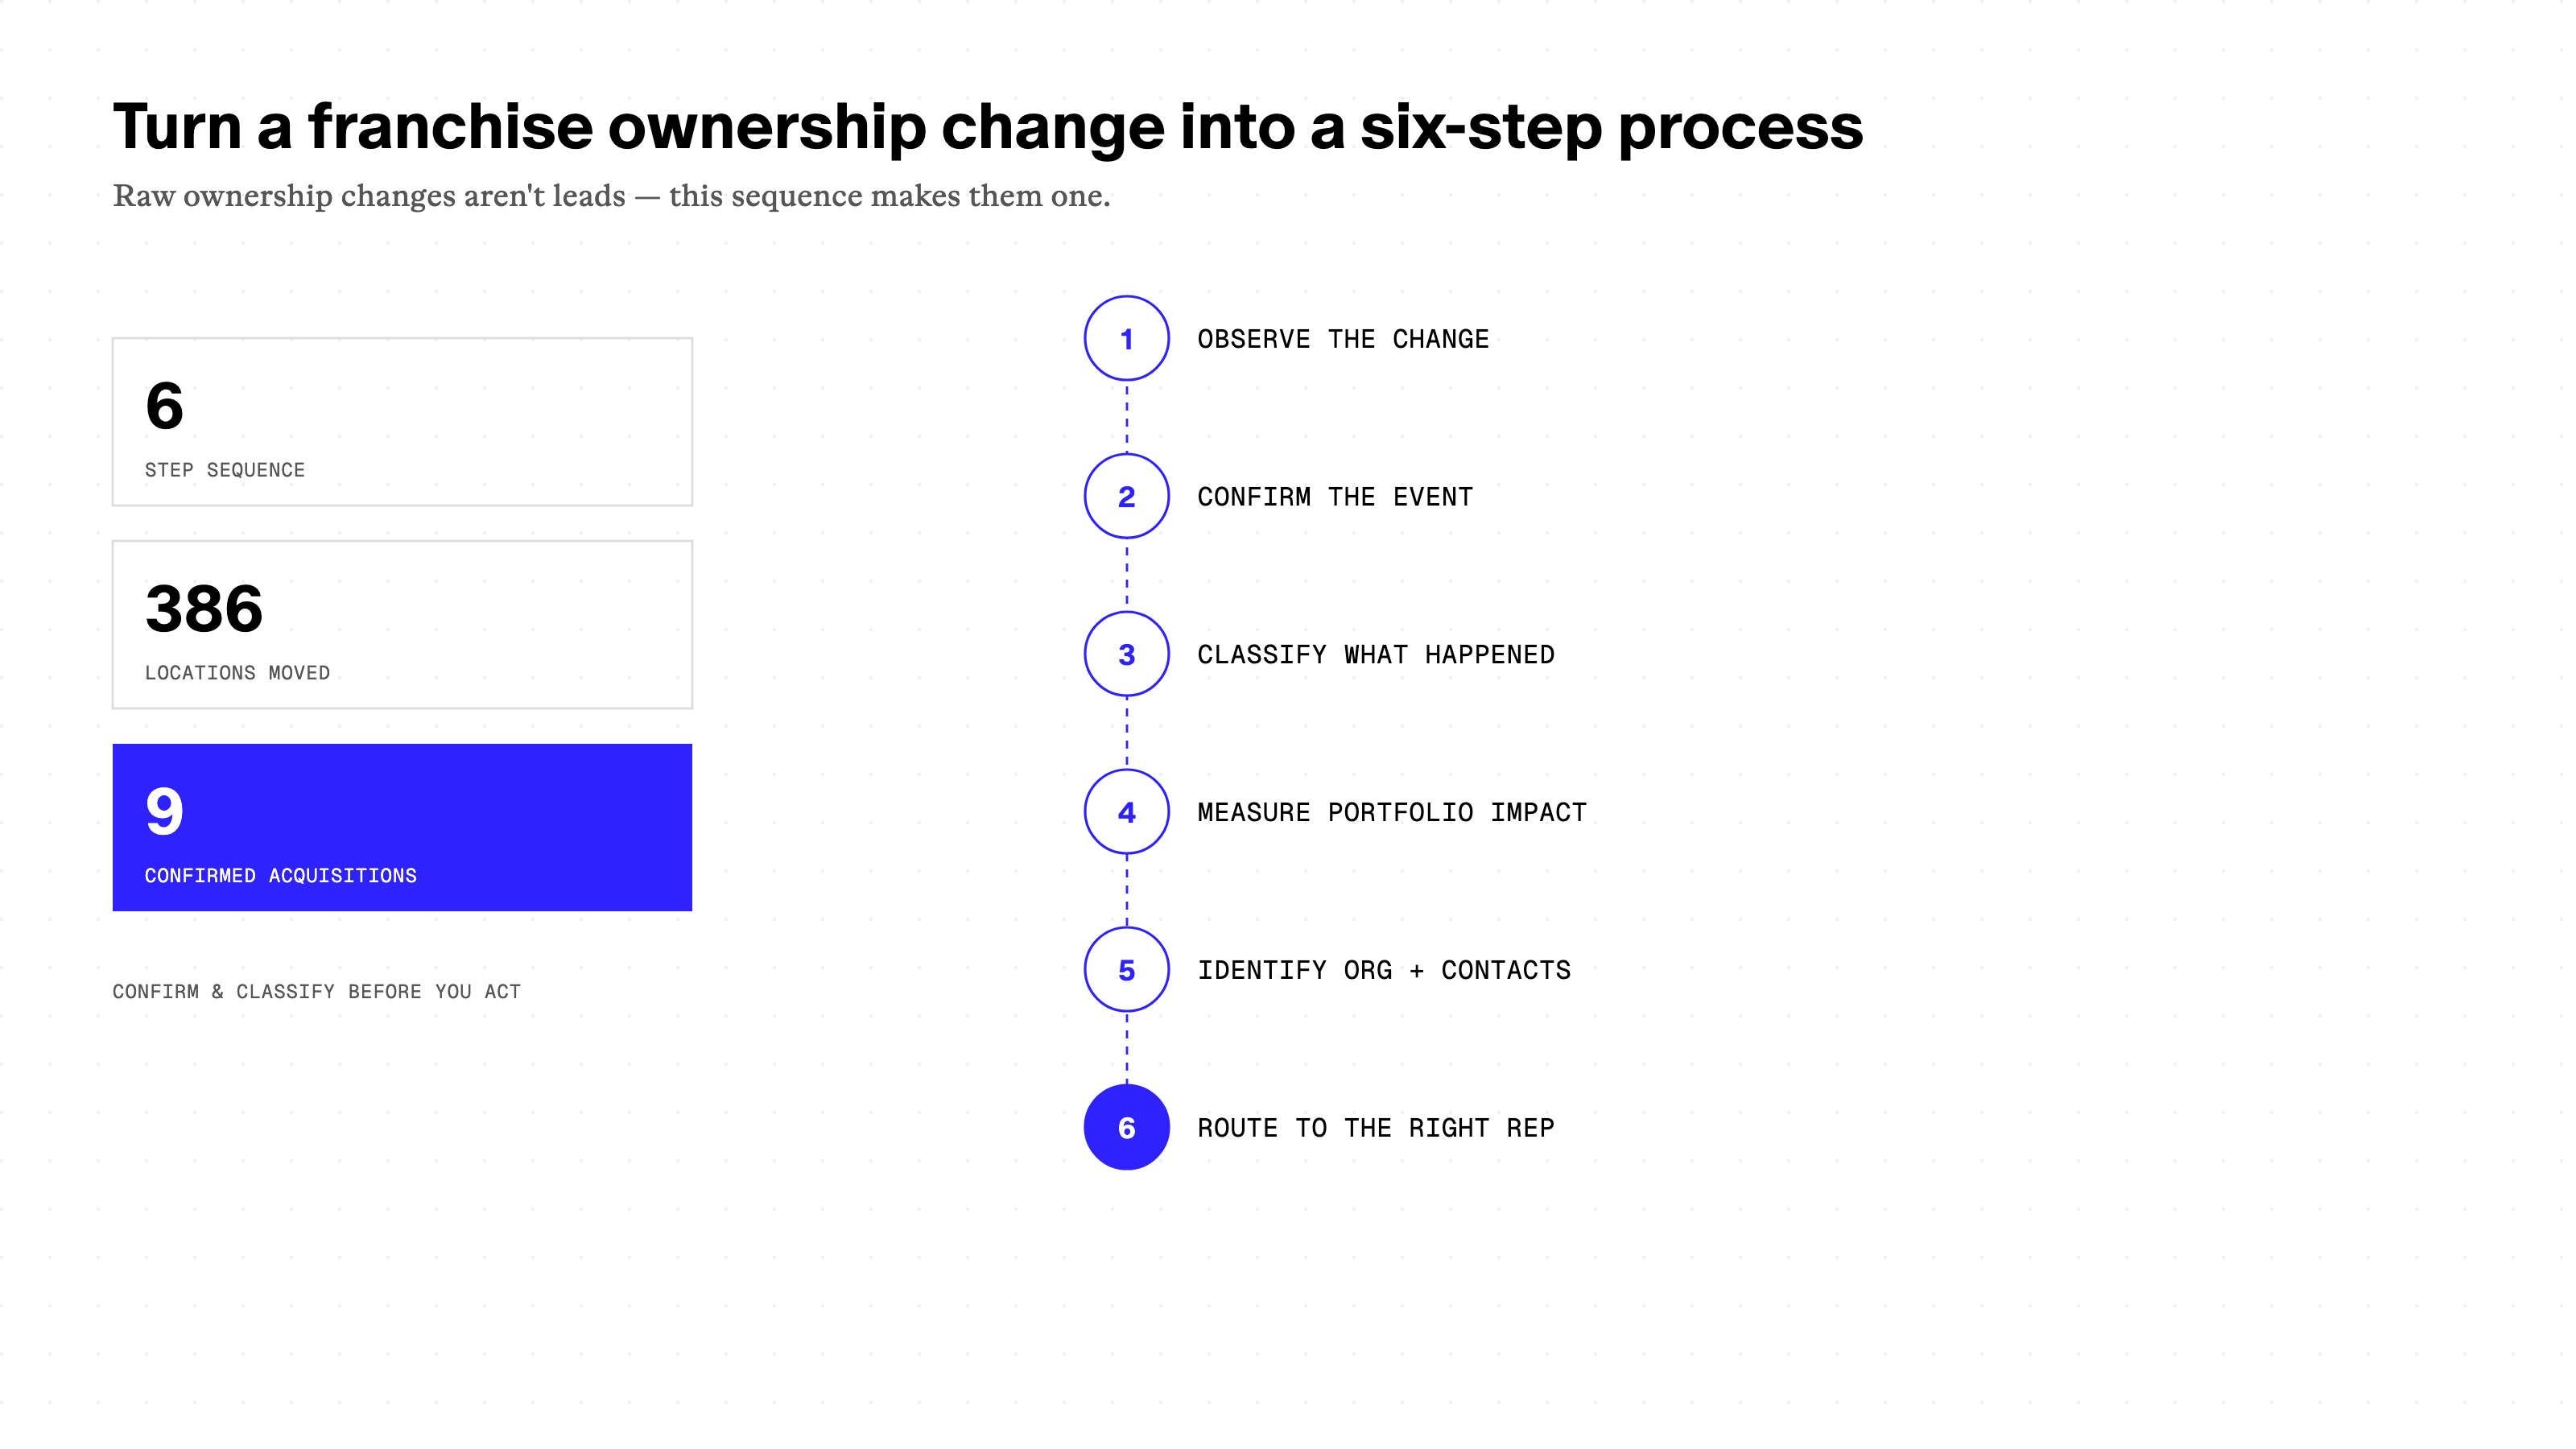
A company buying 30 restaurants is a meaningful business event. An owner changing paperwork or a database correcting a record isn’t. Sales teams shouldn’t treat all three as the same kind of lead.
Scale also changes who may be inside the account
A franchise adding restaurants doesn’t just create a bigger account. It changes who picks up the phone when you call. Datalane found identifiable operations leadership at 11% of 6-20-unit operators, 34% of 21-50-unit groups, and 78% of 51+ operators. Among 51+ groups, 43% have identifiable finance leadership, 30% HR/people leadership, and 26% development or real-estate leadership.
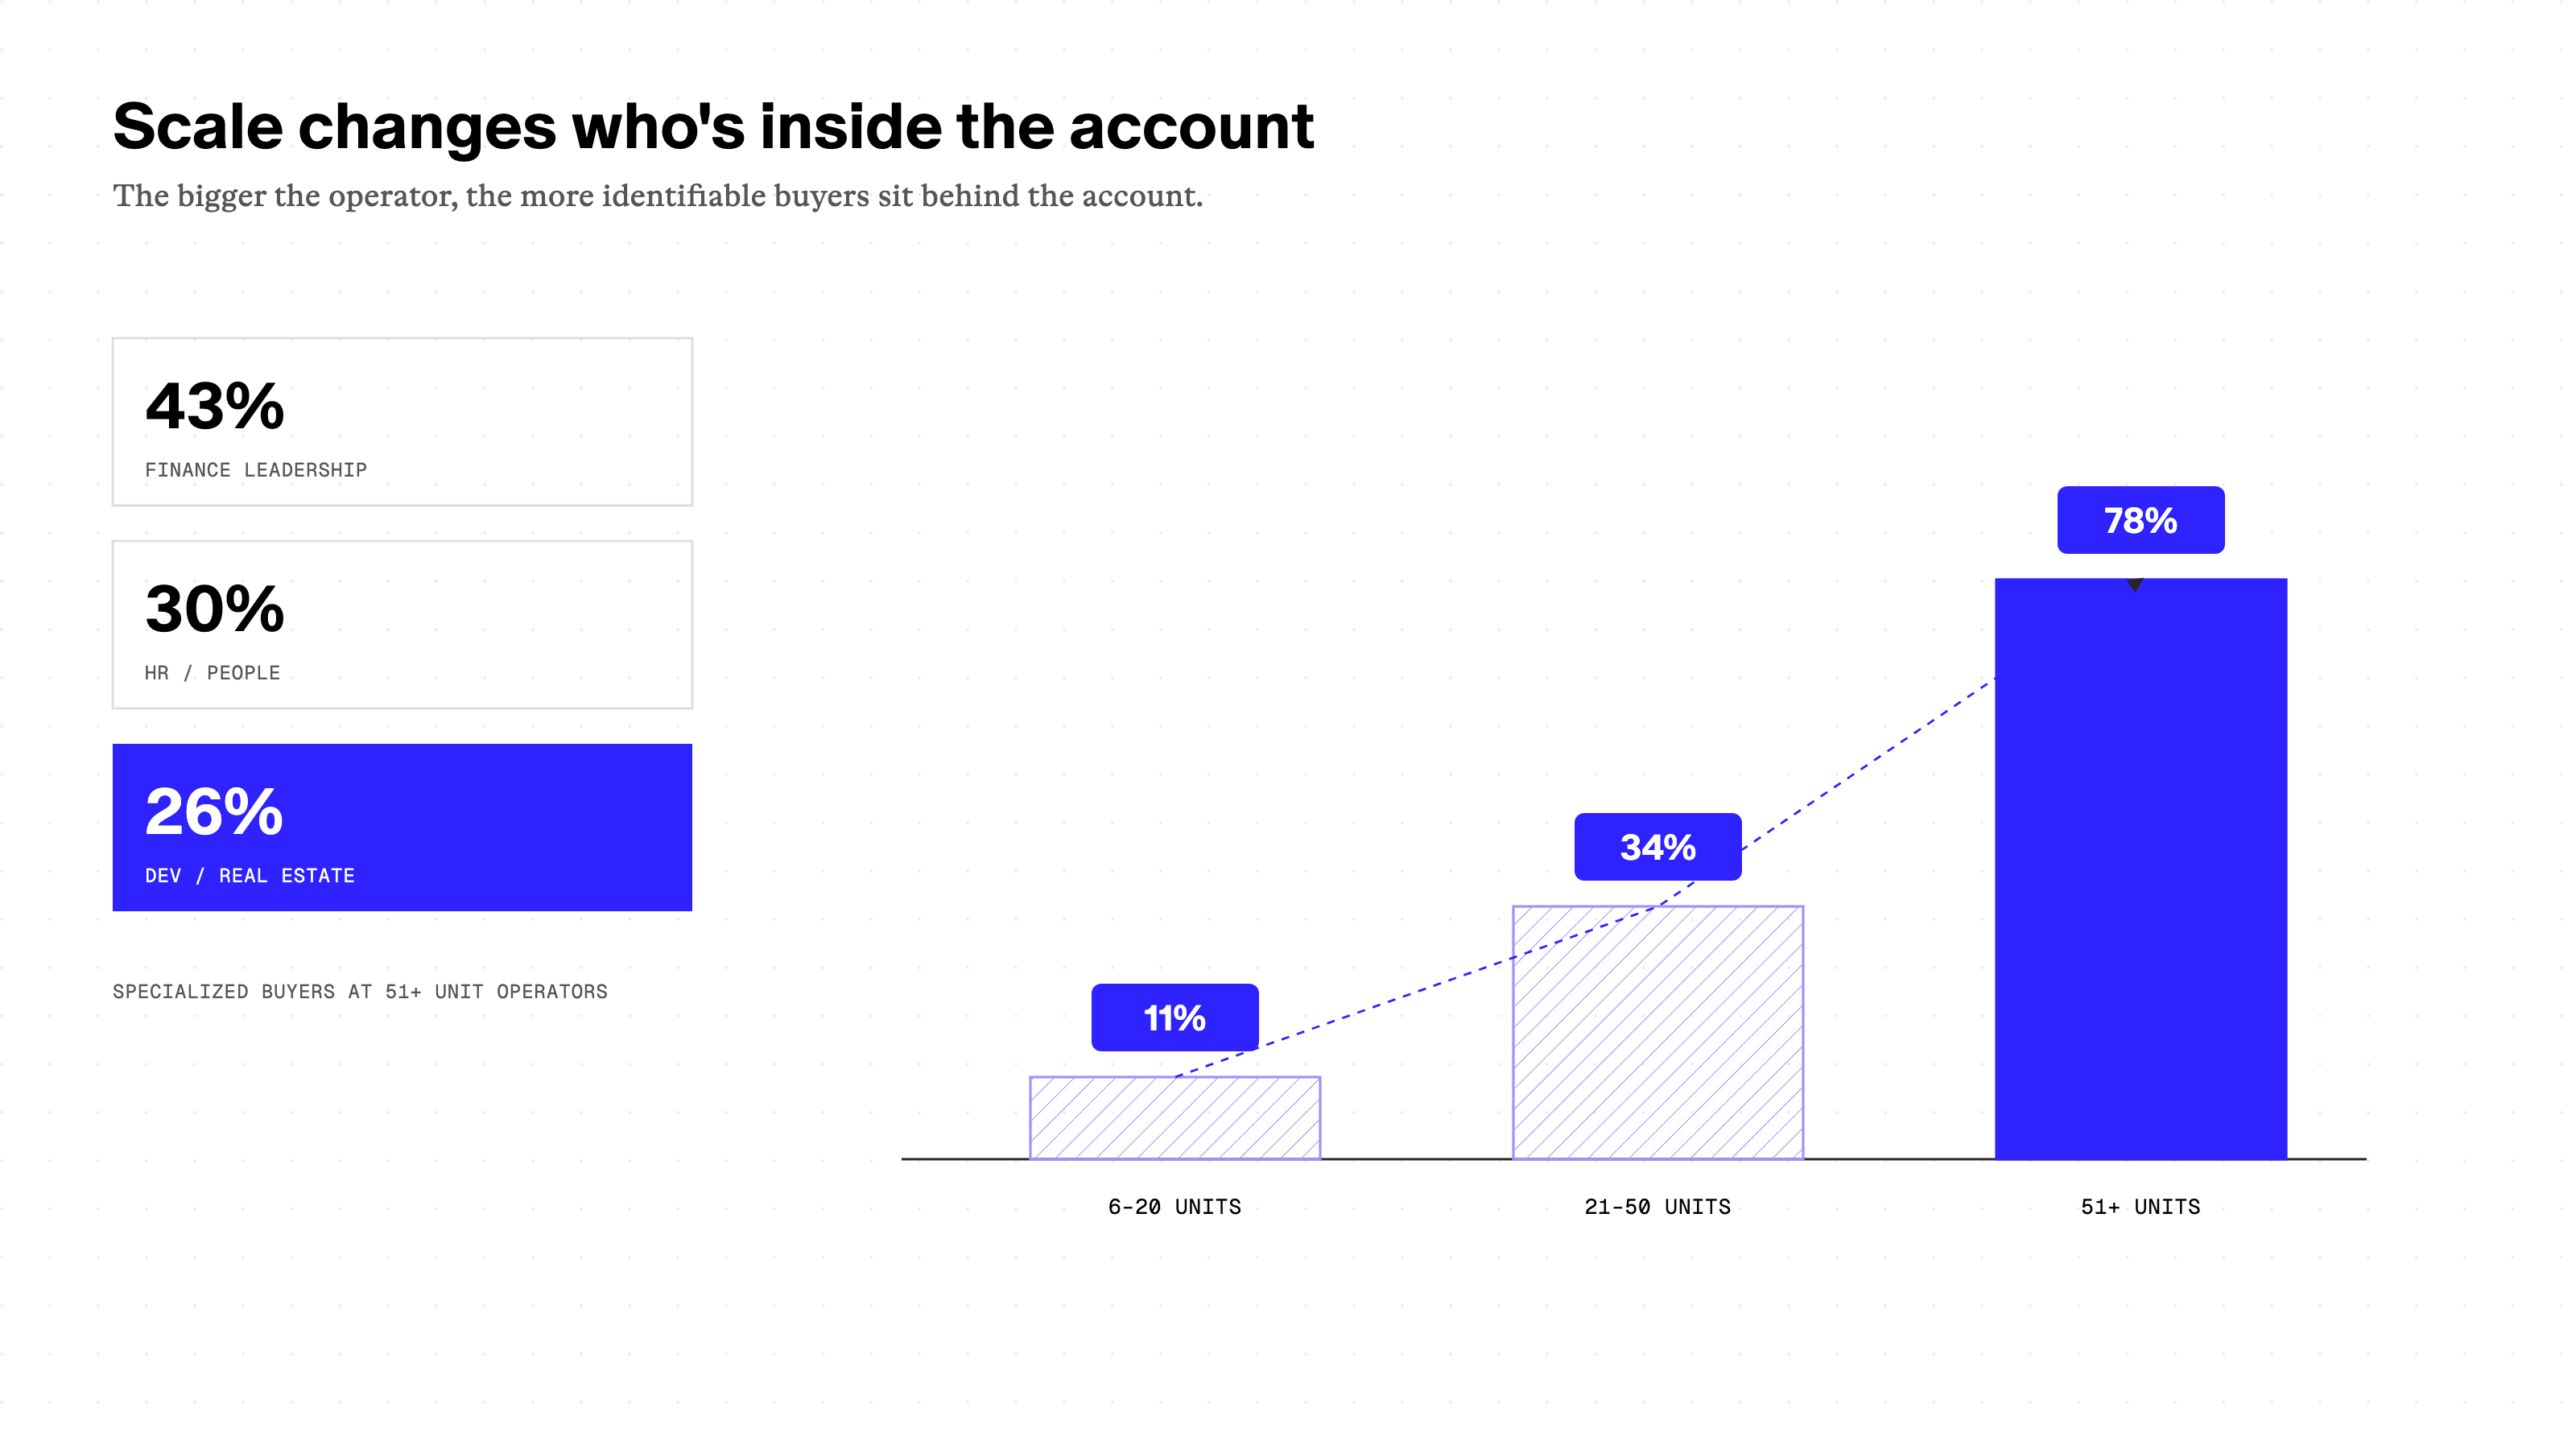
That suggests the sales motion changes as operators professionalize. Smaller franchisees may still center purchasing around the owner-operator, while larger groups are more likely to present specialized functional buyers.
Burger King is the case study; the ownership layer is the bigger story
A location list tells you where businesses operate. An ownership map tells you which businesses are connected. Event classification tells you when that map actually changed. A franchise location changing hands can create a new account, expand an old one, redraw a territory, or change absolutely nothing that matters to a salesperson. Knowing which one happened is the difference between having franchise data and knowing what to do with it.
The right ownership data makes the sales map a lot smaller
That’s the advantage of seeing the franchise system the way Datalane does. Roughly 6,800 Burger Kings become 458 high-confidence organizations, and ownership changes become identifiable business events. Thousands of storefronts become a much shorter list of the companies and people actually worth calling.