Trade is a weak signal
The problem with trade-based segmentation
Most go-to-market teams selling into home services start with trade as their primary segmentation axis. HVAC companies go in one bucket, plumbers in another, electricians in a third.
It feels logical. But when you look at the data, trade is one of the weakest signals you can use to determine whether a business is a fit.
What 505,000 accounts tell us
We analyzed review volume distributions across 505K+ home services businesses in six core trades: HVAC, plumbing, electrical, roofing, landscaping, and pest control.
The finding: within every single trade, the P10 account has 1-2 Google reviews and the P90 has 35-376. That is not variance within a segment. That is two completely different businesses wearing the same label.
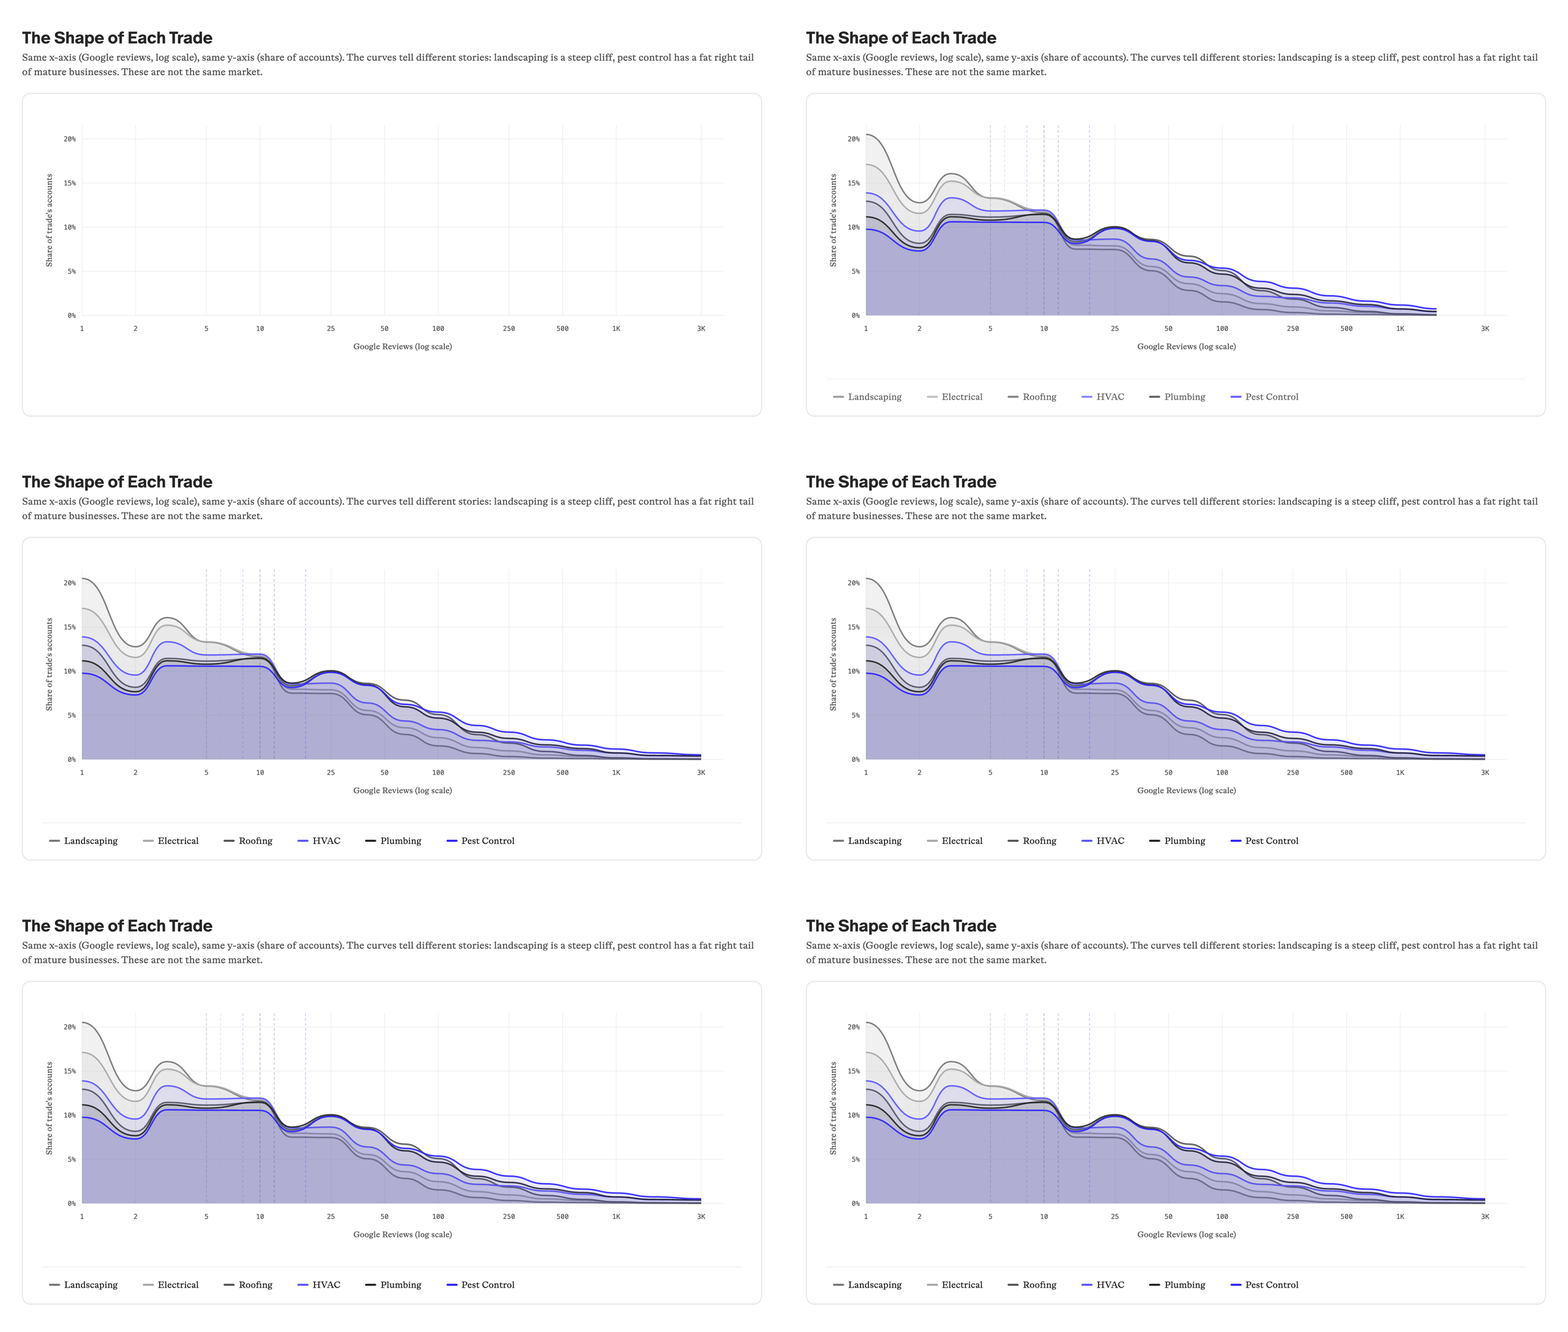
The shape differs by trade
Each trade has a distinct distribution curve:
- Landscaping is a steep cliff. The vast majority of accounts cluster at the low end with very few reviews. The P90/P10 spread is 35x.
- Pest control has a fat right tail of mature, high-review businesses. Average review count is 168, with a P90/P10 spread of 188x.
- Plumbing is the goldilocks trade, enough volume to matter, enough quality signal to segment on. Balanced distribution.
- HVAC and electrical sit in the middle, with moderate spreads but still enormous internal variance.
- Roofing skews seasonal and storm-driven, creating irregular clustering patterns.
What this means for GTM
If your sales team is working a list of "HVAC companies," they are calling a mix of owner-operators with zero online presence and established multi-truck operations with hundreds of reviews. These businesses have different needs, different buying behavior, and different willingness to pay.
Trade gets you into the right neighborhood. It does not get you to the right door.
The teams that win in home services GTM layer additional signals on top of trade: review volume, location count, years in business, licensing status, and contact reachability. The combination is what separates a qualified account from a name on a list.
Key numbers
- 505K+ accounts analyzed across 6 trades
- 40-65% of every trade has fewer than 5 reviews
- 35x to 188x P90/P10 spread depending on trade
- Pest control has the highest average reviews (168), landscaping the lowest (18)
Frequently asked questions
What is within-trade variance in home services?
It's the spread in business size, software adoption, and decision-making style across operators in the same trade. Two HVAC companies in the same zip code can run completely different operations.
Why does within-trade variance matter for GTM?
Because segmenting by trade alone produces a too-broad ICP. A 3-truck HVAC operator and a 50-truck HVAC operator buy differently, hire differently, and need different products.
How do we segment within a trade?
By operational signal, not just SIC code. Truck count, service area, software stack, and ownership structure separate the buyer types more reliably than industry classification.
What data signals indicate within-trade segments?
Fleet size, employee count, multiple location presence, fleet wrap branding, online review volume, and software footprint (ServiceTitan, Housecall Pro, or paper). Each signal narrows the segment.
How does this affect outbound?
Sequences calibrated to one within-trade segment fall flat on others. The owner-operator with 3 trucks and the regional player with 50 hear different value props. Segmenting at this level lifts reply rates meaningfully.
The right call here turns on data coverage and workflow fit, not feature lists.